
Discrete manufacturers average 66.8% OEE today. You lose one-third of your planned production time to unplanned downtime and quality failures. Only 3% of plants reach world-class levels at 85%.
This guide helps your OEE calculation manufacturing process. You will understand availability, performance quality and how to stop the Six Big Losses. High output helps you grow without buying new machines. AI and real-time data help you boost your production results in 2026.
What Is OEE and Why Is It the Gold Standard for Manufacturing Productivity?
Overall Equipment Effectiveness is the most trusted diagnostic tool in modern production. It reveals how much of your manufacturing potential actually becomes a finished product.
Use this metric to identify exactly where you lose money during a shift.
1. OEE vs. TEEP: Two Metrics That Measure Different Things
Manufacturers often confuse OEE with TEEP. They measure different time buckets.
- OEE tracks efficiency during planned production time. It ignores breaks or holidays.
- TEEP (Total Effective Equipment Performance) tracks utilization against all 168 hours in a week.
- Use OEE to improve active shifts. Use TEEP to decide if you need to buy a new machine.
- Mixing them up is dangerous. Reporting TEEP as OEE inflates your score and hides real waste.
2. What an OEE Score Actually Tells You and What It Doesn't
Your OEE score measures the gap between your potential and actual output. A 100% score represents a perfect shift with no defects or stops. World-class OEE at 85% means your line is elite.
Scores below 65% reveal massive hidden waste. It identifies where losses happen, allowing you to focus your repair efforts exactly where they matter.
Tracking these numbers gives you a clear starting point for improvement. Now you need to know how to calculate these values correctly to ensure your data stays accurate.
The OEE Formula and How to Calculate Overall Equipment Effectiveness Correctly
Calculating your OEE correctly is the only way to stop guessing about your factory's output. The OEE formula breaks your production into three parts to show where you lose time and money.
1. The Three OEE Components
Your OEE calculation manufacturing depends on these three ratios. When you multiply them, you see your total efficiency.
- Availability: Divide your actual run time by planned production time. This tracks every minute the machine stopped, including unplanned downtime from breaks or jams.
- Performance: Multiply your ideal cycle time by the total units made. Divide that by your run time. This shows if your machine ran slower than its top speed.
- Quality: Divide your good units by the total units produced. This tracks your first-pass yield and excludes scrap or rework.
When you multiply availability performance quality, the OEE results might surprise you. If each area scores 90%, your OEE is actually 72.9%.
2. Step-by-Step OEE Calculation Example
Use this real-world example to check your own OEE. Imagine a 480-minute shift with 90 minutes of downtime. You made 242 units at an ideal cycle time of 1.5 minutes, but only 230 were good.
- Availability: 390 / 480 = 81.25%
- Performance: (242 × 1.5) / 390 = 93.1%
- Quality: 230 / 242 = 95.0%
- OEE: 0.8125 × 0.931 × 0.950 = 71.8%
3. The Simplified OEE Formula
If you run one product at a time, use this shortcut: (Good Count × Ideal Cycle Time) / Planned Production Time. This gives you the same OEE score quickly. Use the full version when you need to find which specific area needs the most work.
Identifying the score is your first step toward improvement. Now you can look at the specific losses that drag these numbers down every day.
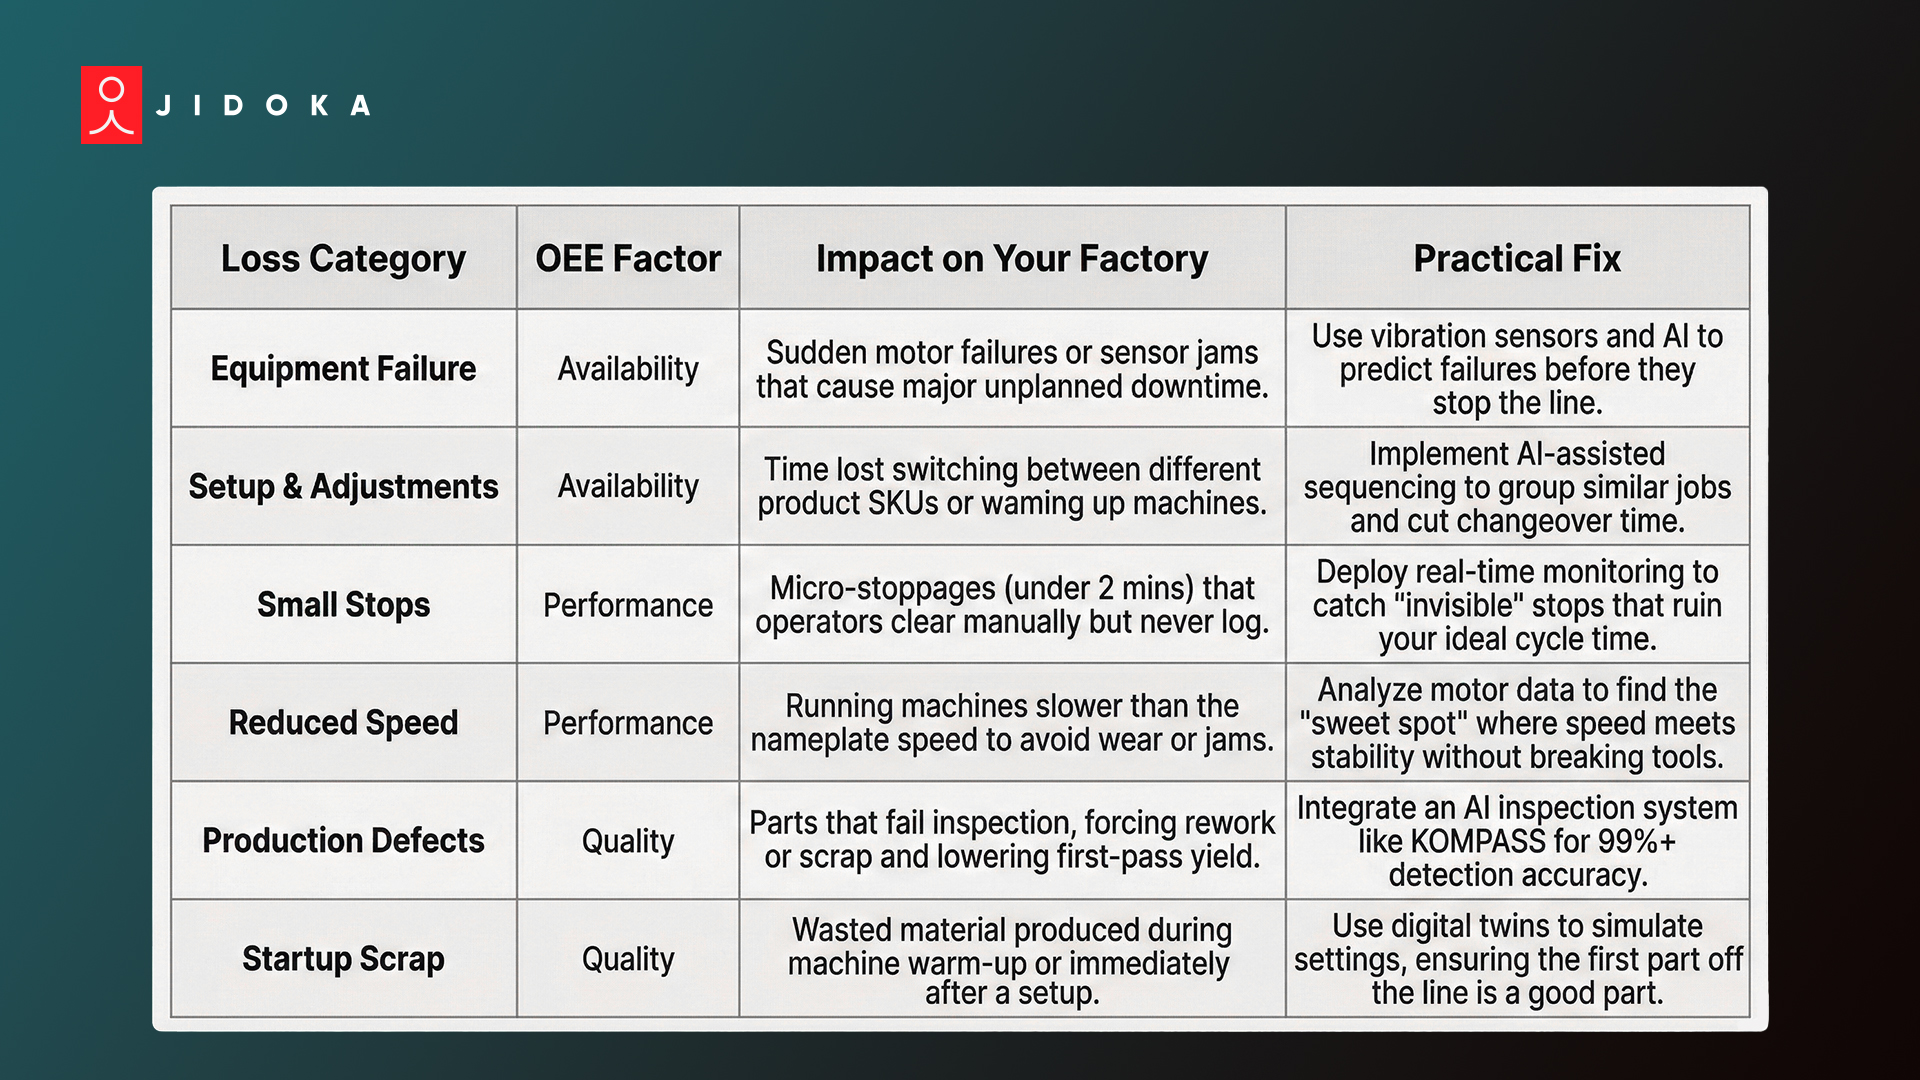
What Is Actually Dragging Your OEE Score Down (The Six Big Losses)
To fix your OEE score, you have to find where you lose the most time. Every factory deals with the Six Big Losses. These six issues fall directly into the three categories of availability performance quality.
A) Availability Losses: Equipment Failures and Changeovers
Availability losses stop machines from running during planned production time.
- Unplanned Downtime: This includes sudden motor failures or jams. These events cause 34.2% of efficiency losses.
- Setup and Adjustments: Changeovers are the second-biggest loss. Moving between products takes time. Using AI-assisted sequencing helps reduce these setup times without hurting compliance.
B) Performance Losses: Small Stops and Reduced Speed
Performance losses are hard to see because the machine is "running" but not at its ideal cycle time.
- Small Stops: These are interruptions under five minutes. They account for 40% of total losses. Manual logs usually miss them, making your OEE calculation manufacturing inaccurate.
- Reduced Speed: This happens when equipment runs slower than its top rate. It often occurs if machines are old or poorly maintained.
C) Quality Losses: Defects and Startup Scrap
Quality losses hit the bottom line hard. You waste energy on a bad part, lowering your first-pass yield.
- Production Defects: These parts fail inspection. Human inspectors miss many defects, which masks your true OEE.
- Startup Scrap: This is product lost during warm-ups.
OEE calculation manufacturing improves when you track these Six Big Losses in real-time. Identifying these gaps is the first step toward Total Productive Maintenance.
The Six Big Losses: A Detailed Breakdown of Your OEE Gaps:
How to Improve OEE in Manufacturing: Practical Methods for 2026
Improving your OEE requires a surgical approach. You cannot fix every issue at once. You must target the Six Big Losses that hit your specific facility the hardest.
1. Targeting the Right Loss Category
Use a Pareto analysis to find the "vital few" problems. This method shows which 20% of issues cause 80% of your unplanned downtime.
- If your availability performance quality data shows that availability is low, focus on maintenance to stop breakdowns during planned production time.
- If your first-pass yield is the problem, check your raw materials or machine calibration.
Stop wasting money on new hardware when your data shows that long changeover times are the real culprit. This is where your OEE calculation manufacturing becomes a roadmap rather than just a report.
2. Real-Time OEE Monitoring vs. Manual Shift Reporting
Manual logs create 8-hour blind spots. By the time you read a paper report, the chance to fix a speed loss is gone. Modern OEE calculation manufacturing requires real-time data to capture every ideal cycle time deviation and stop unplanned downtime instantly.
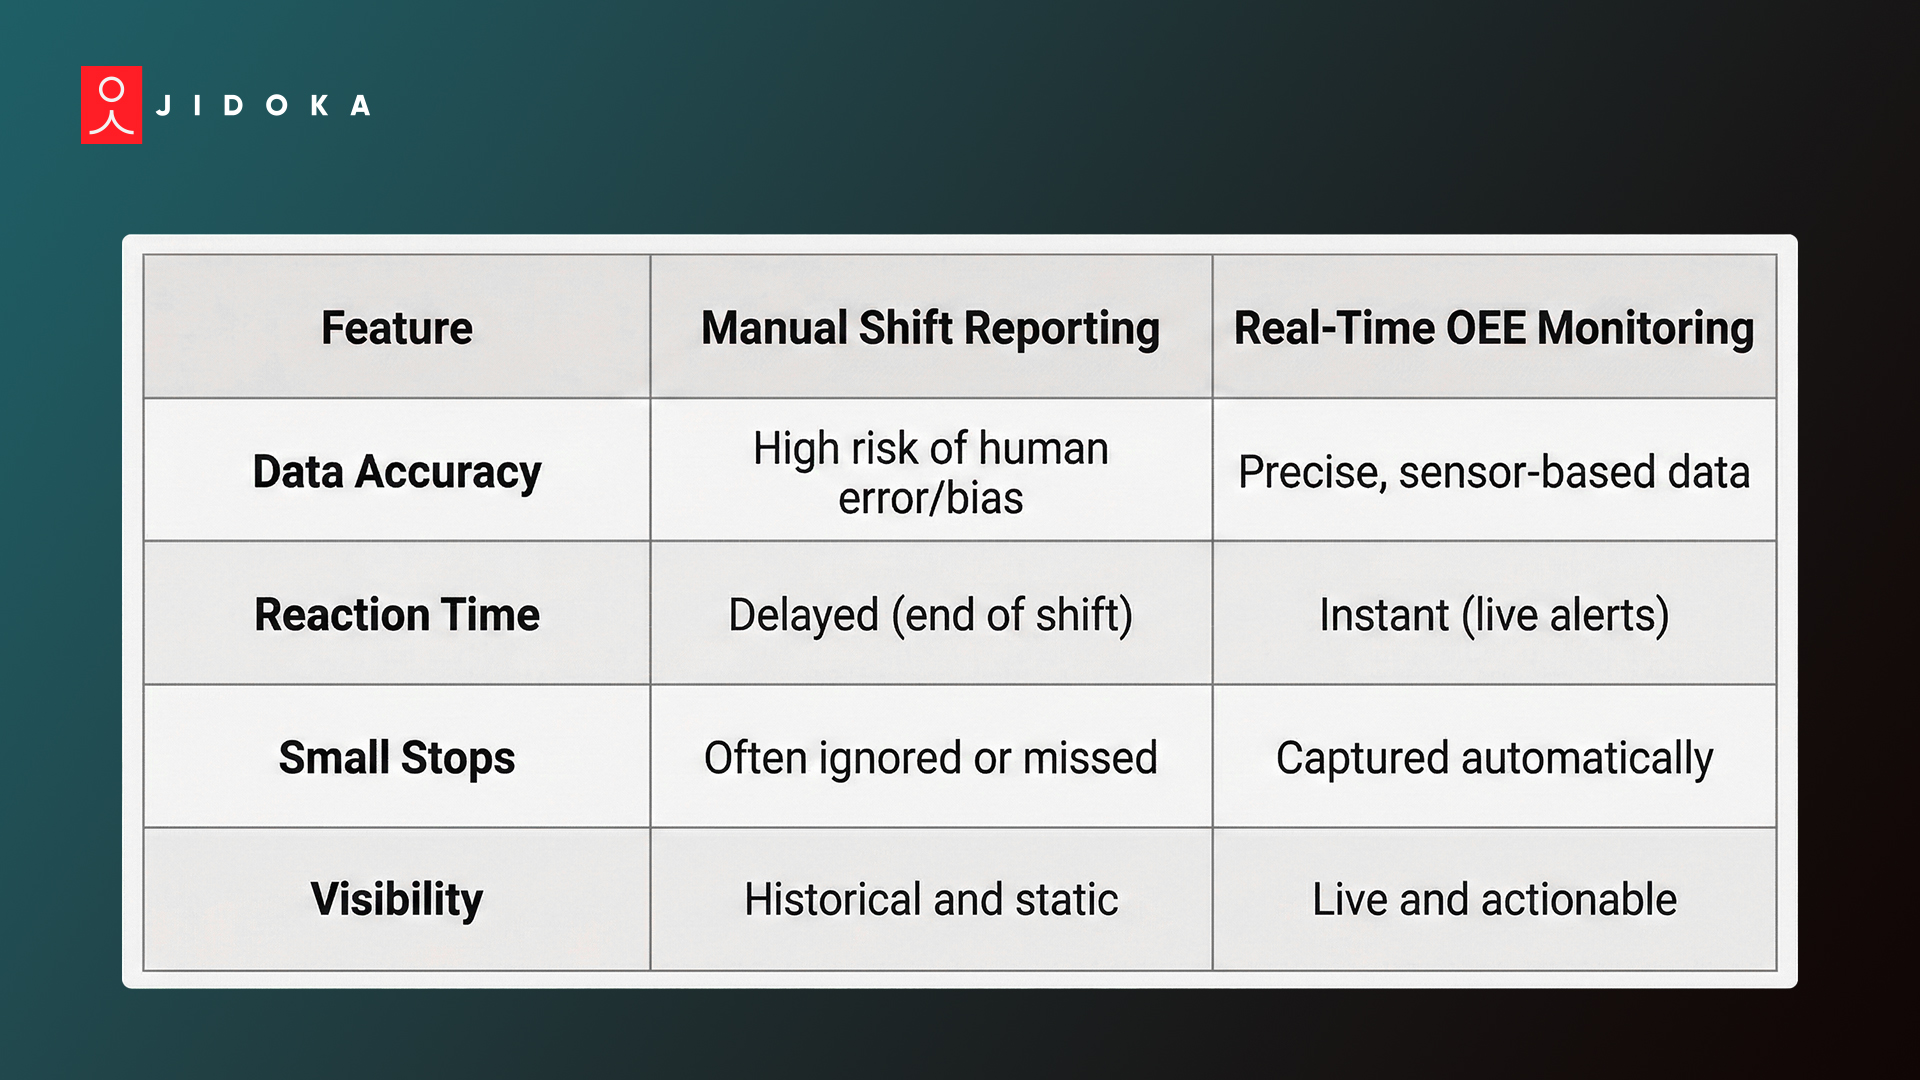
Moving toward a world-class OEE score of 85% is easier when you have a clear, live view of your floor. This visibility allows you to use advanced tools like AI to refine your process.
How Jidoka Tech Improves the Quality Component of OEE With KOMPASS and NAGARE
Jidoka Technologies offers a specialized AI inspection system designed for high-speed manufacturing environments. Our platform directly boosts your OEE by tackling quality and performance losses simultaneously.
- KOMPASS AI powered inspection system: This tool achieves 99.8%+ accuracy, even on reflective or textured parts. It processes frames in under 10ms, significantly lifting your first-pass yield.
- NAGARE process monitoring: This system tracks 100% of assembly steps. By flagging missing parts or wrong sequences in real-time, it cuts rework by 20–35%.
- Edge Processing: The entire automated defect detection system runs on local edge units. This eliminates lag, ensuring your OEE calculation manufacturing data stays accurate even at speeds of 12,000 parts per minute.
Using these intelligent inspection solutions helps you hit world-class OEE benchmarks by eliminating the "hidden factory" of rework and manual errors.
Explore Jidoka Tech to see how AI-driven vision can transform your shop floor productivity.
Conclusion
OEE proves how much of your production potential actually reaches the finish line. Most manufacturers lose one-third of their capacity to the Six Big Losses, yet these inefficiencies remain hidden in manual logs.
Ignoring these gaps leads to shrinking margins, wasted capital on unneeded machinery, and a complete loss of competitive edge. You cannot afford to run blind while rivals optimize.
Jidoka Technologies solves this by providing real-time data visibility and AI inspection system tools. By targeting availability performance quality with AI, you recover lost capacity and move toward world-class OEE without adding new equipment.
Connect with Jidoka Technologies to audit your current performance and eliminate the hidden losses in your production line.
FAQs
1. What does OEE stand for and what does it measure?
OEE stands for Overall Equipment Effectiveness. It measures the percentage of planned production time that is truly productive. By calculating availability performance quality, it identifies how much of your shift is lost to unplanned downtime, speed drops, and manufacturing defects.
2. What is a good OEE score in manufacturing?
An OEE score of 85% is the world-class OEE benchmark. While most discrete manufacturers average 66.8%, anything below 65% signals serious issues. Tracking your OEE formula helps you reach elite performance by eliminating the Six Big Losses across your floor.
3. How do you calculate OEE?
Your OEE calculation manufacturing requires multiplying availability, performance, and quality. Use the OEE formula to multiply your run time ratio, ideal cycle time efficiency, and first-pass yield. This combined score reveals the "hidden factory" causing your production losses.
4. What is the difference between OEE and TEEP?
OEE measures efficiency during your scheduled production time. TEEP (Total Effective Equipment Performance) measures output against all 24/7 calendar hours. Use OEE for daily process improvement and TEEP for long-term capital planning or determining if you need more machines.
5. What are the Six Big Losses in OEE?
The Six Big Losses include equipment failures, setup time, small stops, reduced speed, production defects, and startup scrap. These categories map directly to availability performance quality, helping you pinpoint exactly why your OEE calculation manufacturing results are lower than expected.
6. How does AI improve OEE in manufacturing?
An AI inspection system boosts OEE by catching defects instantly to improve first-pass yield. AI also reduces unplanned downtime through predictive maintenance and tracks ideal cycle time in real-time. This automation ensures your OEE formula results consistently hit world-class targets.