Jeder Betriebsleiter weiß, an welcher Station der Engpass liegt. Das sieht man direkt in der Produktion. Doch zu wissen, dass eine Station im Rückstand ist, und zu verstehen, warum das so ist, sind zwei völlig verschiedene Dinge – und in den meisten Werken fehlen Live-Daten, um dies zu unterscheiden.
Liegt ein Maschinenfehler vor? Überspringt ein Bediener Arbeitsschritte? Kommt das Material aus der vorgelagerten Fertigung zu spät an? Ohne die richtigen Tools zur Workflow-Überwachung basieren Antworten auf Klemmbrettern am Schichtende und Bauchgefühl. Zu diesem Zeitpunkt ist der Produktionsausfall bereits besiegelt.
Dieser Leitfaden stellt fünf Arten von Workflow-Überwachungstools vor, die fünf verschiedene Engpasskategorien adressieren und jeweils mit der bereits vorhandenen Infrastruktur Ihres Werks eingesetzt werden können.
Die fünf Engpasstypen und das passende Tool zur Lösung
Bevor Sie sich für ein Workflow-Überwachungstool entscheiden, steht eine Frage am Anfang: Mit welcher Art von Engpass haben Sie es zu tun? Die meisten Vergleiche von Überwachungstools überspringen diesen Schritt komplett und stellen die Tools als austauschbare Optionen dar. Das sind sie nicht. Jeder Typ adressiert eine spezifische Fehlerquelle.
Nutzen Sie diese Tabelle als Diagnosefilter. Identifizieren Sie, welcher Typ Ihren Engpass beschreibt, und lesen Sie dann den entsprechenden Abschnitt.
Tool 1: IoT-sensorbasierte OEE-Überwachung
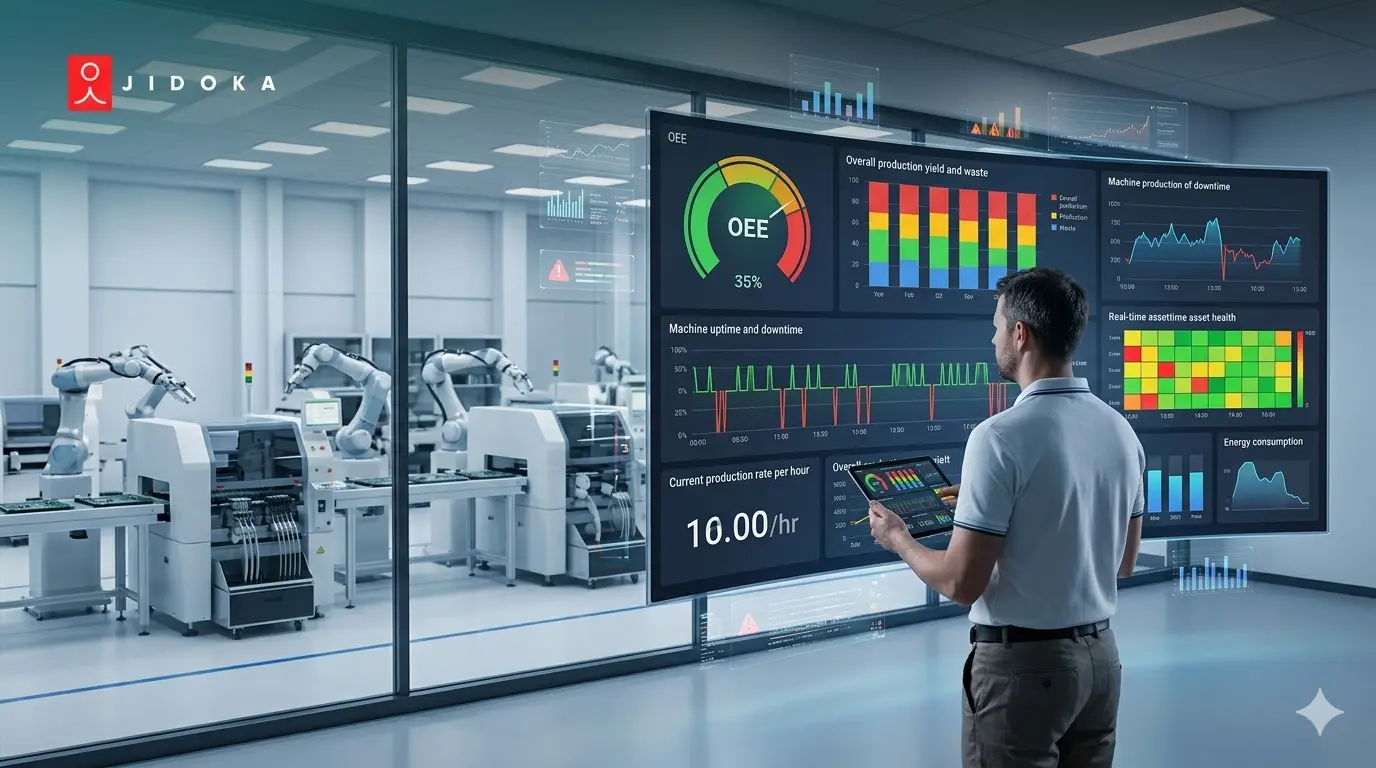
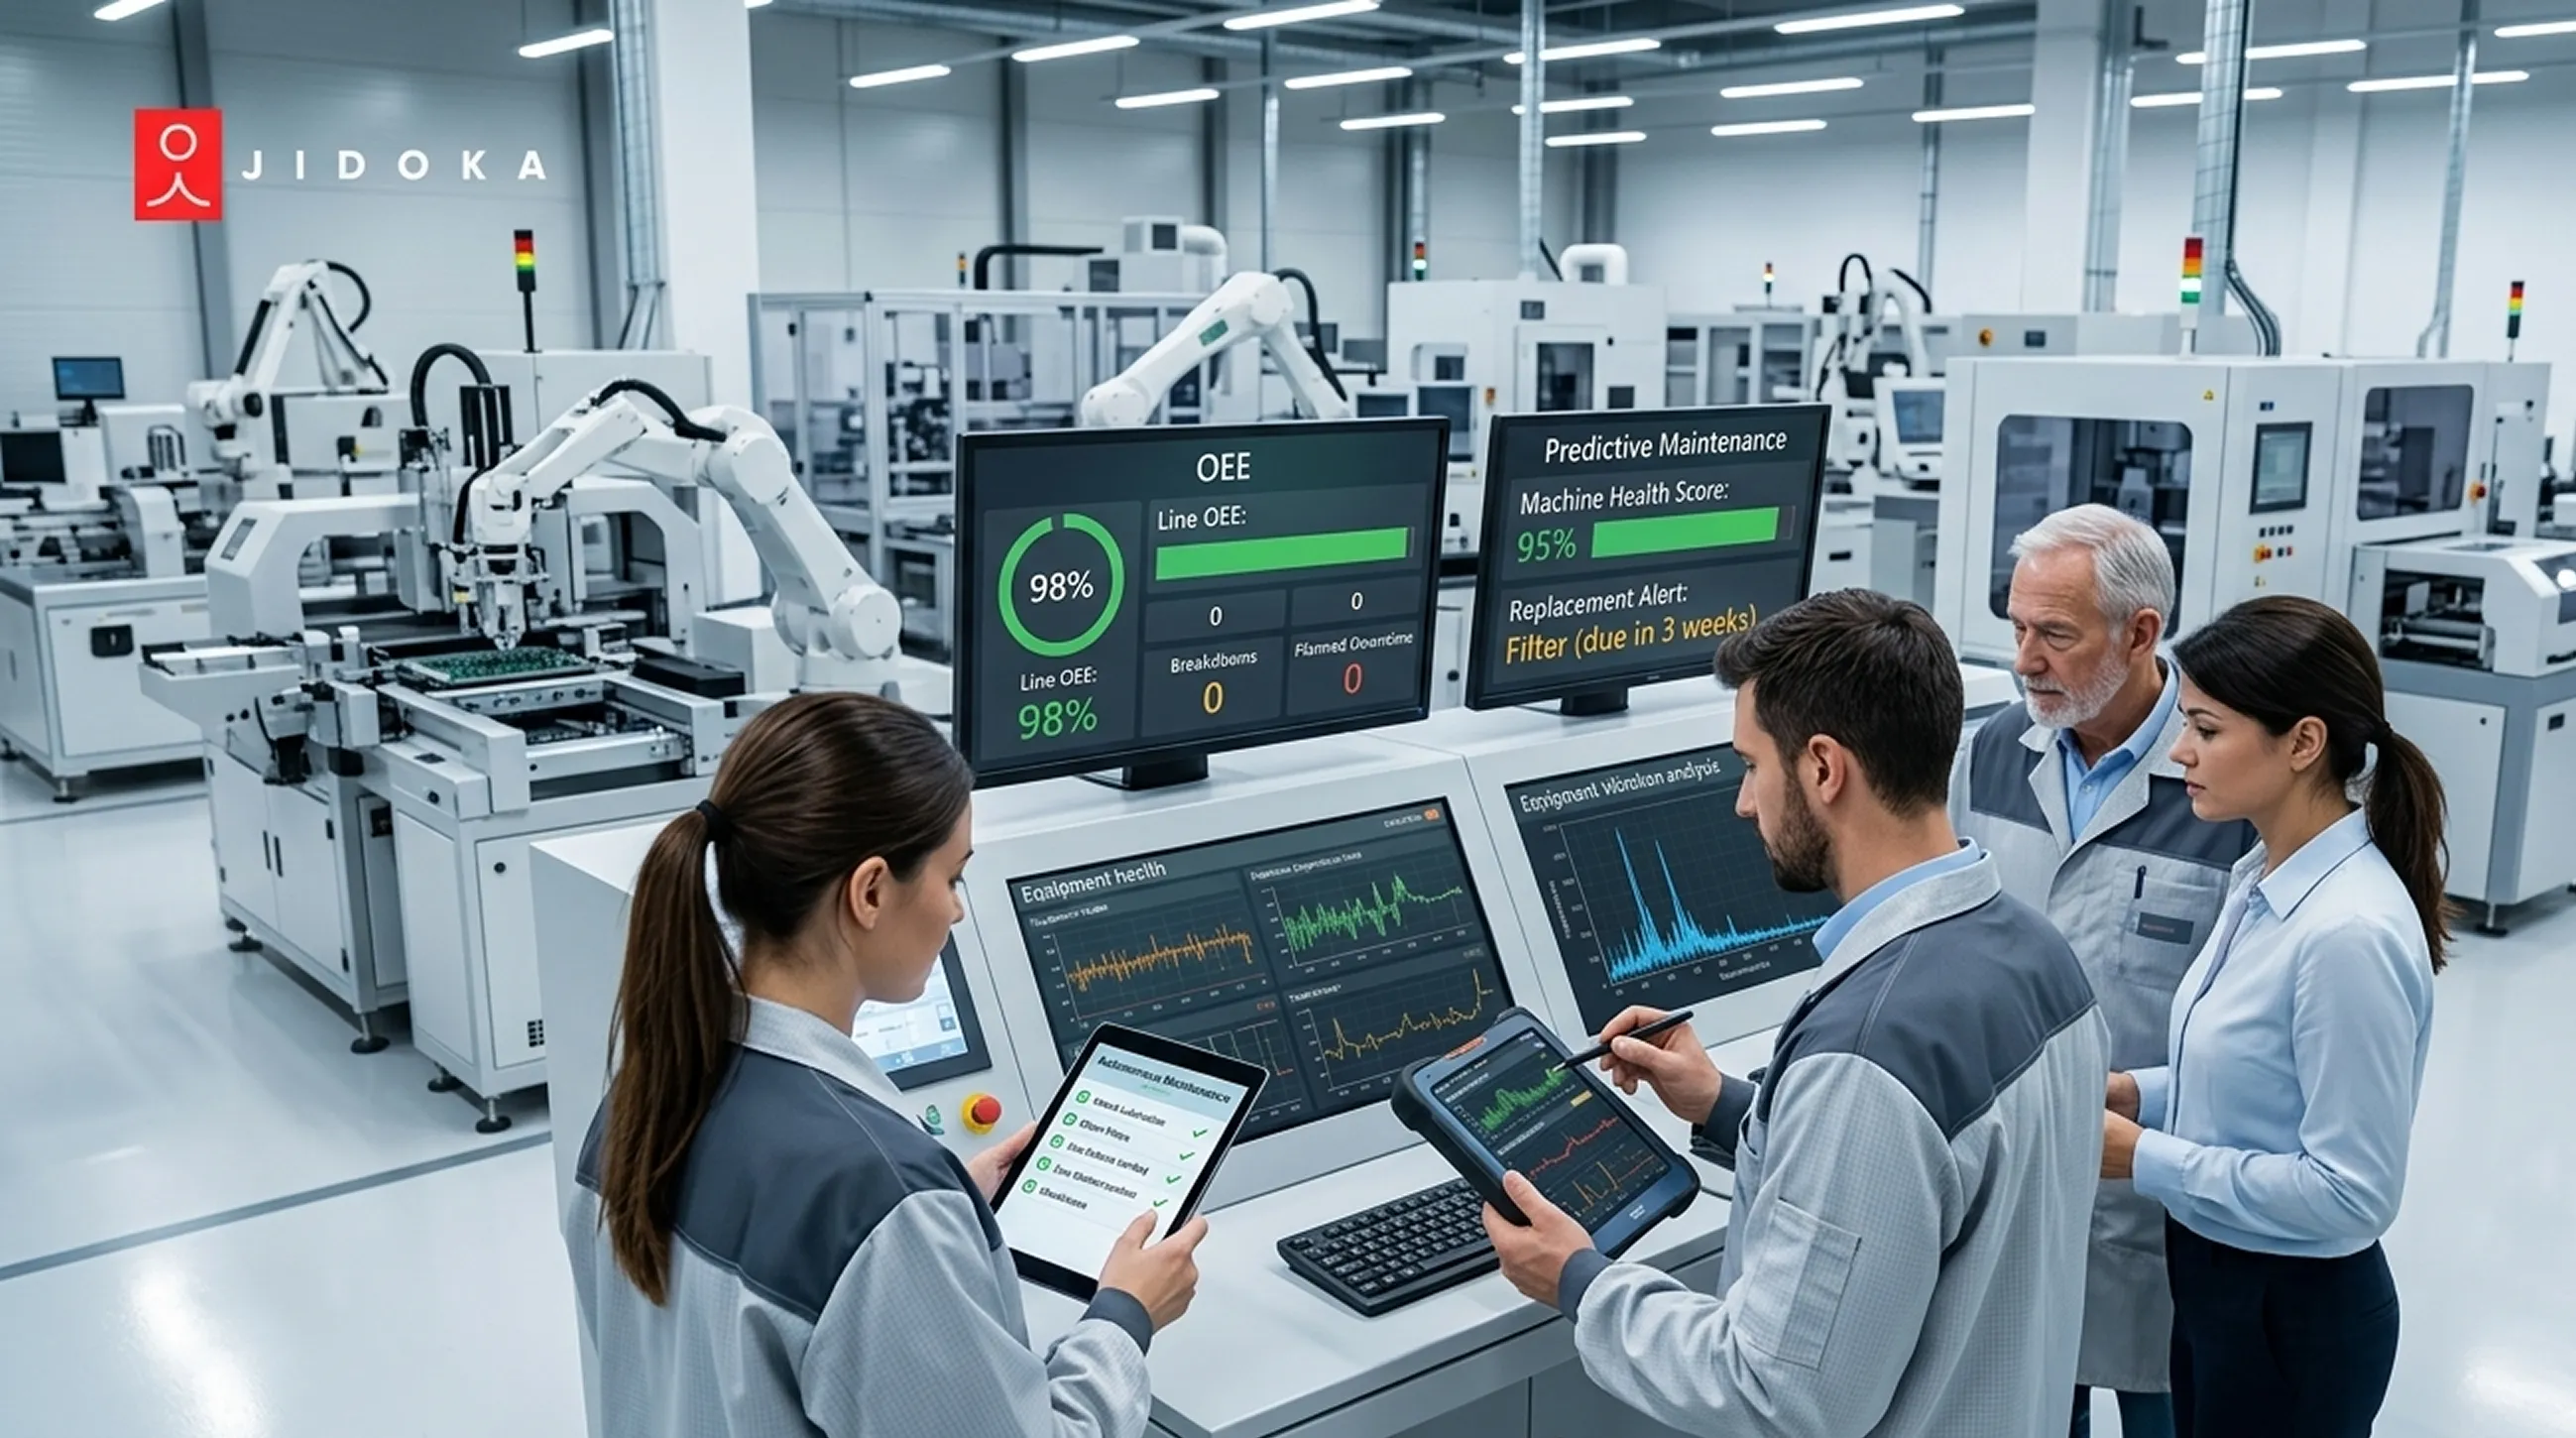
Die IoT-sensorbasierte OEE-Überwachung ist ein Tool, das Verfügbarkeits- und Geschwindigkeitsverluste von Maschinen adressiert. Dabei werden Stromzangen an die bestehende Maschinenverkabelung angeschlossen – ohne SPS-Änderungen, ohne Produktionsstopp und ohne Investitionsbudget für neue Anlagen.
Dies adressiert die Engpasstypen 1 und 2. Es erfasst den Lauf-/Stopp-Zustand der Maschine, die Taktzeit, die Dauer von Stillständen mit Fehlercodes sowie die Häufigkeit von Mikrostopps in der gesamten Fertigung.
Der Bereitstellungsmechanismus ist das entscheidende Unterscheidungsmerkmal. Stromzangen werden einfach an das Stromkabel einer beliebigen Maschine geklemmt und erkennen den Maschinenzustand anhand der Stromverbrauchsmuster. Ein SPS-Zugriff ist nicht erforderlich. Eine hydraulische Presse aus den 1990er Jahren ohne Steuernetzwerk wird in derselben Sitzung instrumentiert wie ein modernes CNC-Bearbeitungszentrum. Die meisten Implementierungen liefern innerhalb von 48 Stunden nach der Sensorinstallation Live-OEE-Daten. (Quelle)
Die richtige Überwachungssoftware für die Maschinenverfügbarkeit beginnt hier: Es ist die einzige Ebene, die Mikrostopps automatisch erfasst, ohne in die bestehende Maschinenarchitektur einzugreifen.
Was sich in der Produktion ändert
Die ersten zwei Wochen mit IoT-OEE-Daten lösen bei Betriebsleitern eine einheitliche Reaktion aus: Die tatsächliche OEE ist niedriger als die geschätzte. Die Lücke entsteht fast ausschließlich durch Mikrostopps – Stopps von unter fünf Minuten, die Bediener nicht zuverlässig protokollieren können und die SPS-Systeme komplett übersehen. (Quelle)
Sobald diese Stopps sichtbar werden, folgt der Verbesserungsprozess einer klaren Abfolge:
- Ermitteln Sie, welche Maschine die höchste Frequenz an Mikrostopps aufweist
- Verfolgen Sie die drei häufigsten Stoppgründe pro Maschine
- Richten Sie Echtzeit-Warnmeldungen für das Bedienpersonal auf Maschinenebene ein
Das Workflow-Tracking-System wird zum Instrument für tägliche Leistungsgespräche anstelle von retrospektiven Berichten am Schichtende.
Einschränkung
IoT-OEE-Monitoring bestätigt, dass eine Maschine gestoppt hat. Es kann jedoch nicht feststellen, ob der Stopp durch ein Problem bei der Materialzufuhr, einen Rückstau oder eine Bedienhandlung verursacht wurde. Diese Unterscheidung erfordert eine zweite Datenebene.
Genannte Tools in dieser Kategorie: TeepTrak, MachineMetrics, Evocon, Tractian OEE.
Wie eine Maschine stoppt und warum sie gestoppt hat, sind zwei verschiedene Fragen – genau das ist der Grund, warum der nächste Tool-Typ entwickelt wurde.
Tool 2: Digitale Andon- und Visual-Management-Plattformen
Digital Andon ist ein Workflow-Monitoring-Tool, das Materialflussstörungen behebt, indem es vom Bediener ausgelöste Produktionsereignisse (Stopps, Materialengpässe, Qualitätsstopps) in Echtzeit-Warnmeldungen umwandelt, die die zuständige Person in Sekundenschnelle erreichen.
Dieses Tool läuft auf Hardware, die im Werk bereits vorhanden ist: Bildschirme in der Fertigung, Tablets oder Smartphones. Es ist keine neue Signalisierungshardware erforderlich. Die Softwareebene ersetzt physische Signalsäulen durch konfigurierbare digitale Warnmeldungen, die in dem Moment, in dem ein Problem gemeldet wird, an den zuständigen Vorgesetzten oder Logistikverantwortlichen weitergeleitet werden.
Der Engpass, den es beseitigt, ist die Reaktionszeit. Ein Materialengpass an Station 4 löst in dem Moment, in dem der Bediener ihn meldet, eine Warnmeldung auf dem Telefon des Logistikleiters aus. Bei einem physischen Andon-System müsste man darauf warten, dass ein Vorgesetzter physisch an der Signalsäule vorbeiläuft. (Quelle)
Was sich in der Fertigung ändert
Die Lücke zwischen Problemerkennung und Reaktion durch den Vorgesetzten ist der effektivste Hebel zur Produktivitätssteigerung, den ein Werk ohne Investitionsausgaben nutzen kann. Die Verringerung dieser Lücke verändert den operativen Rhythmus der gesamten Fertigung.
Ein Workflow-Tracking-System, das jeden Andon-Auslöser protokolliert, liefert die Daten auf Schichtebene, die CI-Leiter benötigen, um zu ermitteln, welcher Ereignistyp über einen Monat hinweg die meiste kumulierte Reaktionszeit beansprucht. Dieses Protokoll fließt direkt in die retrospektive Engpassanalyse ein, ohne dass zusätzliche Datenerfassungsschritte erforderlich sind.
Einschränkung
Digital Andon zeigt an, wo ein Problem aufgetreten ist. Es erklärt jedoch nicht, ob die Ursache ein Maschinenfehler, eine Prozessabweichung oder ein tatsächlicher Materialmangel war. Die Identifizierung der Grundursache erfordert eine Korrelation mit OEE-Daten oder Prozessüberwachungsdaten.
Genannte Tools in dieser Kategorie: TeepTrak (datengetriebenes Andon), Fabrico, MachineMetrics Bedieneroberfläche.
Zu wissen, wo ein Problem aufgetreten ist, ist nicht dasselbe wie zu verstehen, wie es entstanden ist – genau diese Lücke soll Process Mining schließen.
Tool 3: Process Mining und Workflow-Analyse
Process Mining ist ein Workflow-Überwachungstool, das Ereignisprotokolle aus bereits vorhandenen MES-, ERP- oder QMS-Systemen ausliest und abbildet, wie Produktionsaufträge, Qualitätssperren und Arbeitsanweisungen tatsächlich durch das Werk gelaufen sind – im Vergleich zum geplanten Ablauf.
Es ist keine neue Datenerfassung erforderlich. Die Daten sind bereits vorhanden. Was Process Mining hinzufügt, ist die analytische Ebene, die Abweichungen im Ablauf und Nacharbeitsschleifen erstmals sichtbar macht.
Der Engpass, den es aufdeckt, ist eine Kategorie, die OEE-Dashboards niemals erfassen: Verzögerungen bei Genehmigungsworkflows und Nacharbeitsrouten. Eine Qualitätssperre, die einen Produktionsauftrag für vier Stunden pausiert, erscheint nicht in einem OEE-Diagramm. In einem Process-Mining-Tool wird dies als Abweichung vom geplanten Prozesspfad über mehrere Knoten hinweg dargestellt, inklusive exaktem Zeitstempel und Auftragsnummer.
Was es aufdeckt, das Dashboards verborgen bleibt
KI-Funktionen für Prozess-Workflows in Plattformen wie Celonis und Microsoft Power Automate Process Mining können gleichzeitig mehrere Objekttypen (Aufträge, Komponenten, Qualitätsereignisse) verfolgen und den spezifischen Interaktionspunkt aufzeigen, an dem der Fluss ins Stocken gerät.
Ein auf Process Mining basierendes Workflow-Tracking-System zeigt genau, wo die Auftragssteuerung abgewichen ist, wie häufig diese Abweichung auftritt und welcher Genehmigungs- oder Qualitätsschritt den Verzögerungskern bildet. Diese Präzision können OEE-Dashboards und Schichtprotokolle allein nicht liefern.
Einschränkung
Process Mining ist retrospektiv. Es identifiziert, wo der Prozess abgewichen ist; es verhindert die Abweichung jedoch nicht in Echtzeit. Für die prozessuale Durchsetzung in Echtzeit auf Bedienerebene ist Tool 5 zuständig.
Genannte Plattformen: Celonis, Microsoft Power Automate Process Mining, SAP Signavio.
Tool 4: MES-integrierte Produktionsverfolgung
Die MES-integrierte Produktionsverfolgung ist ein Tool zur Workflow-Überwachung, das den tatsächlichen Output in Echtzeit mit dem geplanten Produktionsplan auf Ebene der Arbeitsaufträge abgleicht. So sieht der Schichtleiter sofort, ob die Schicht im Plan liegt, bevor wertvolle Zeit verloren geht, die nicht mehr aufgeholt werden kann.
Dieses Tool greift auf bereits vorhandene MES- oder Produktionsplanungsdaten vor Ort zu. Die Datenebene ist also bereits vorhanden; das Tool ergänzt lediglich ein Echtzeit-Dashboard, das diese Informationen direkt während der Schicht sichtbar macht, statt erst im Nachhinein.
Der Kontrollgang des Schichtleiters mit dem Klemmbrett ist die häufigste Schwachstelle in der Überwachung der Fertigung. Er ist langsam, stichprobenartig und bestätigt nur, was bereits geschehen ist, anstatt Möglichkeiten zur Korrektur aufzuzeigen.
Die vier Fragen, auf die ein Schichtleiter in Echtzeit Antworten braucht
Jedes der fünf Tools zur Workflow-Überwachung beantwortet eine oder mehrere dieser vier Fragen, die ein Vorgesetzter während jeder Schicht kontinuierlich im Blick haben muss.
Ein Workflow-Tracking-System, das alle vier Fragen beantwortet, erfordert mehr als nur eine Überwachungsebene. Genau deshalb stellt dieser Artikel fünf verschiedene Tool-Typen vor und nicht nur eine einzige Plattform.
Die Transparenz von Fertigungsdaten auf Ebene des Soll-Ist-Vergleichs ist der wichtigste KPI, auf den ein Vorgesetzter während der Schicht reagieren kann. Er entscheidet darüber, ob ein Rückstand noch aufgeholt werden kann oder ob das Tagesziel verfehlt wird.
Einschränkung
Das MES-Tracking zeigt, ob der Plan eingehalten wird. Es erklärt jedoch nicht, an welcher Station es hakt oder warum. Diese diagnostische Ebene wird durch OEE-Monitoring für maschinenbedingte Ursachen und KI-gestützte Bildverarbeitung für bedienerbedingte Ursachen abgedeckt.
Beispiel-Tools: ShopVue MES, Plex by Rockwell Automation, SAP DMC (Modul für Produktionsüberwachung).
Tool 5: KI-gestützte Prozessüberwachung
Die KI-gestützte Prozessüberwachung ist ein Tool zur Workflow-Überwachung, das speziell für die Bediener- und Prozessebene entwickelt wurde und 100 % der Montageschritte über vorhandene IP-Kameraserfasst. Es identifiziert Stationen, die die Taktzeit überschreiten, und meldet Abweichungen, bevor das Teil den nächsten Prozessschritt erreicht.
Dies adressiert die Engpasstypen 3 und 5: Abweichungen im Bedienerprozess und Schwankungen zwischen den Schichten. Dies sind Kategorien, die kein Maschinensensor, kein ERP-Protokoll und kein OEE-Dashboard erfassen kann. Der Bediener ist anwesend, die Maschine läuft, und dennoch bleibt der Output hinter den Erwartungen zurück. Die Ursache liegt hier rein auf der Prozessebene.
Funktionsweise mit bestehender Infrastruktur
Die Edge-KI-Inferenz-Engine wird mit dem bestehenden IP-Kameranetzwerk verbunden und läuft lokal – ohne Cloud-Abhängigkeit, ohne SPS-Anbindung und ohne Unterbrechung der Produktion. Live-Produktionsdaten jeder überwachten Station fließen in einen kontinuierlichen Vergleich der Taktzeiten mit der digitalen Standardarbeitsanweisung ein.
Nagare fungiert als Workflow-Tracking-System für die Montageebene und lässt zwei KI-Streams parallel laufen:
- Objekterkennung: Welche Komponenten sind an der jeweiligen Station vorhanden?
- Aktionserkennung: Was tut der Werker und in welcher Reihenfolge?
Wird ein Arbeitsschritt übersprungen, in der falschen Reihenfolge ausgeführt oder dauert er länger als die Standardtaktzeit, meldet das System dies in Echtzeit, bevor das Werkstück die nächste Station erreicht.
Wie Jidoka Technologies die Überwachungslücke schließt
Werke, die lediglich OEE-Monitoring-Software einsetzen, haben Einblick in Maschinenverluste. Werke mit MES-Tracking wissen, ob die Schicht im Plan liegt. Jidoka Technologies entwickelt Workflow-Monitoring-Tools für den Bereich, den beide übersehen: die Werker- und Prozessebene, auf der Nacharbeit, Taktzeitabweichungen und Qualitätsmängel entstehen, die von keinem Sensor erfasst werden.
Nagare überwacht 100 % der Montageschritte über vorhandene Kameras und meldet Abweichungen in Echtzeit. KOMPASS, das hochpräzise KI-Inspektionssystem des Unternehmens, erreicht eine Genauigkeit von über 99,8 % in der laufenden Produktion bei einer Bildverarbeitungszeit von unter 10 ms. Beide Systeme laufen auf lokalen Edge-Einheiten ohne Netzwerklatenz und ohne Cloud-Abhängigkeit während der Produktion.
Wenn der Engpass in Ihrer Linie auf der Werker- und Prozessebene liegt, erfahren Sie, wie Nagare mit Ihrer bestehenden Kamerainfrastruktur funktioniert. Vereinbaren Sie einen Rundgang mit dem Jidoka-Team.
Fazit
Das richtige Tool zur Workflow-Überwachung ist genau auf Ihre spezifische Engpassart abgestimmt. Verluste bei der Maschinenverfügbarkeit deuten auf IoT-OEE-Monitoring hin. Blockaden im Materialfluss erfordern ein digitales Andon-System. Abweichungen im Ablauf, die in historischen Daten sichtbar werden, lassen sich durch Process Mining aufdecken. Diskrepanzen zwischen Plan und Ist erfordern MES-Tracking. Abweichungen in der Arbeitsweise von Bedienern und Schichtschwankungen lassen sich am besten durch KI-gestützte visuelle Überwachung erfassen.
Jedes der fünf hier vorgestellten Tools zur Workflow-Überwachung zielt auf eine andere Fehlerquelle ab, und drei davon lassen sich mit der bereits vorhandenen Infrastruktur in Ihrem Werk umsetzen. Das richtige System zur Workflow-Nachverfolgung für Ihre Fertigung ist dasjenige, das genau die Überwachungslücke schließt, die Ihr aktuelles Setup offen lässt.
Wenn Ihre Verluste auf der Prozess- und Bediener-Ebene entstehen, lassen Sie uns gemeinsam herausfinden, was Nagare an Ihrer Linie aufdeckt.
Häufig gestellte Fragen
1. Was ist ein Tool zur Workflow-Überwachung in der Fertigung?
Ein Tool zur Workflow-Überwachung erfasst Echtzeitdaten darüber, wie die Produktion durch eine Anlage läuft, einschließlich Maschinenzustand, Bedieneraktionen, Planeinhaltung und Einhaltung der Prozessabfolge. Verschiedene Arten von Workflow-Überwachungstools adressieren unterschiedliche Kategorien von Engpässen. Die Wahl des richtigen Tools beginnt damit, zu identifizieren, welche Art von Engpass Sie diagnostizieren möchten – nicht damit, welche Plattform die meisten Integrationen bietet.
2. Kann Workflow-Überwachung ohne die Installation neuer Hardware funktionieren?
Ja. Drei der fünf hier vorgestellten Workflow-Überwachungstools lassen sich mit bestehender Infrastruktur nutzen. IoT-Stromzangen lassen sich ohne Änderungen an der SPS an die vorhandene Maschinenverkabelung anschließen. Process Mining liest Daten aus bestehenden MES- und ERP-Ereignisprotokollen aus. KI-basierte visuelle Überwachung läuft über Edge-KI-Verarbeitung auf bereits vorhandenen IP-Kameras. Digitales Andon läuft auf Tablets oder Smartphones, die bereits in der Fertigung vorhanden sind.
3. Was ist der Unterschied zwischen OEE-Monitoring und Prozessüberwachung bei der Identifizierung von Engpässen?
OEE-Monitoring identifiziert, wann eine Maschine gestoppt hat und ob sie unter der Nennleistung lief. Prozessüberwachung identifiziert, ob der Bediener die Schritte in der richtigen Reihenfolge und mit der korrekten Geschwindigkeit ausgeführt hat. Ein vollständiges System zur Workflow-Nachverfolgung, das OEE und Prozessüberwachung kombiniert, erfasst beide Fehlerarten, da eine Linie eine akzeptable OEE melden kann, während gleichzeitig Abweichungen im Ablauf zu Nacharbeit führen, die von keinem Maschinensensor erfasst wird.
4. Wie hilft KI bei der Identifizierung von Fertigungsengpässen?
KI trägt zwei wesentliche Fähigkeiten zur Datentransparenz in der Fertigung bei. Erstens analysiert KI Maschinensensordaten, um Mikro-Stopps und Geschwindigkeitsanomalien zu erkennen, die für manuelle Protokolle zu kurz sind. Zweitens überwachen KI-gestützte visuelle Systeme die Aktionen der Bediener in Echtzeit und identifizieren, an welcher Montagestation es zu Überschreitungen der Taktzeit kommt. Nagare von Jidoka Technologies verfolgt Taktzeiten kontinuierlich an jeder überwachten Station und deckt Taktzeitverletzungen auf, sobald sie auftreten – nicht erst am Ende der Schicht.
5. Welches Workflow-Monitoring-Tool eignet sich am besten zur Beseitigung von Engpässen am Fließband?
Engpässe am Fließband lassen sich am effektivsten durch die Kombination von IoT-OEE-Monitoring für maschinenbedingte Verluste und KI-gestützter visueller Prozessüberwachung für bedienerbedingte Verluste beheben. Ein Workflow-Tracking-System, das OEE und KI-gestützte visuelle Überwachung kombiniert, adressiert sowohl maschinen- als auch bedienerbedingte Ursachen. Während die OEE anzeigt, dass eine Station hinter dem Ziel zurückbleibt, identifiziert Nagare von Jidoka Technologies genau, welcher Arbeitsschritt in welcher Schicht Zeitverluste verursacht.