A quality manager with a 96% first-pass yield is celebrated at the monthly management review. That 4% reject rate represents 4,000 units per 100,000 produced, found and rejected after the full cost of materials, labour, and machine time had already been consumed.
Every defect in that 4% was produced by a process condition that existed before any inspection check caught it. The inspection system is finding defects efficiently. It is not preventing them.
This guide explains the structural shift from reactive inspection to the next generation of quality control: how the four data layers work, what the four-stage implementation looks like, and what the financial return actually compounds from.
Predictive quality control shifts manufacturing quality from finding defects after production to preventing them during it. AI predictive quality analytics monitor process parameters, sensor data, and vision inspection outputs simultaneously, detecting the conditions that produce defects before non-conforming units are made. The result is a proactive quality management AI system that acts on process signals, not on finished rejects.
Why Reactive Inspection Is Structurally Incapable of Preventing Defects
Reactive inspection finds defects after production conditions have already produced them. Whether inspection runs at end-of-line, in-process, or on a sampling basis, the defect being detected was created upstream, by a process condition that had already run, already consumed materials and machine time, and already produced more rejects between the last check and the current one.
AI-driven quality control detects defects at 99%+ accuracy, 10x faster than human inspection (Hashmeta AI Manufacturing Guide). Detection speed is not the limitation. The structural problem is the production window between inspection events during which defective units are made. Even the fastest inspection system cannot address a defect that was determined upstream of the inspection point, by a process parameter that had already run for minutes or hours.
Gap 1: The Temporal Gap Between Deviation and Detection
Every inspection method has a minimum detection latency: the time between when a process deviation begins producing defects and when inspection finds the first defective unit. End-of-line inspection may have a latency of an entire production run. In-process sampling inspection has a latency that varies with sampling frequency.
For a line producing 500 units per hour with a two-hour inspection interval, the deviation that starts at 09:00 is not found until 11:00, by which time 1,000 units have been produced under the defective condition.
Reactive inspection cannot close this gap by getting faster. It can only find defects that already exist. This prevention architecture addresses the gap before it opens, by monitoring the process conditions that create defects rather than the products those conditions have already produced.
Gap 2: The Coverage and Sampling Constraint
End-of-line sampling inspection, even at rigorous AQL levels, leaves a structural gap between the sampled units and the total production volume. If a defect mode appears on unit 47 and the next sample is unit 100, unit 47 and every unit between them that shares the defect condition has already passed through the system.
A proactive defect prevention system does not rely on sampling. It monitors every production cycle through a combination of 100% AI vision coverage and continuous process parameter monitoring.
Gap 3: The Cost Accumulation Before Detection
Every defect that inspection finds after production has already consumed its full manufacturing cost. Materials used, machine time spent, labour applied. Inspection does not reverse that consumption. Prevention changes the economic structure: a process deviation caught before the first defective unit is made eliminates the full cost of those units, not just the cost of finding and reworking them.
The AI manufacturing market is growing from $34.18 billion to $155.04 billion by 2030 precisely because the economics of prevention structurally outperform the economics of detection at scale (tech-stack.com, March 2026).
How Predictive Quality Control Works at the Data Layer
Predictive quality control does not replace inspection. It adds three data layers above it: SPC control charts that detect statistical drift in process parameters, AI vision classification that produces structured defect event data, and multivariate correlation models that link process conditions to quality outcomes before the first defective unit is produced.
Layer 1: IIoT Sensor and Process Parameter Data
Layer 1 captures the process conditions that drive defect production: machine temperature, vibration, pressure, fill-level, seal head force, conveyor speed, and any other parameter that varies between good and bad production. This is the data the process generates continuously, regardless of whether anyone is watching it. IIoT sensors and PLC outputs are the standard collection mechanism.
Layer 1 alone is not a predictive system. Sensor data tells you that a machine parameter has changed. It does not tell you whether that change will produce a defect, or what type. Layers 2 through 4 provide that answer.
Layer 2: Statistical Process Control Integration
Layer 2 applies SPC control charts to the Layer 1 parameter streams, detecting when a process is trending out of control before it crosses a threshold that produces defective output. CUSUM, EWMA, and Western Electric rule detection identify early deviation signals that a simple threshold alarm would miss. SPC delivers 20 to 40% defect reduction compared with inspection-based approaches when applied to process parameters continuously (Oxmaint SPC Manufacturing AI Guide, April 2026). Layer 2 is the foundation of AI predictive quality analytics: it is the earliest detection layer, firing before defects are produced.
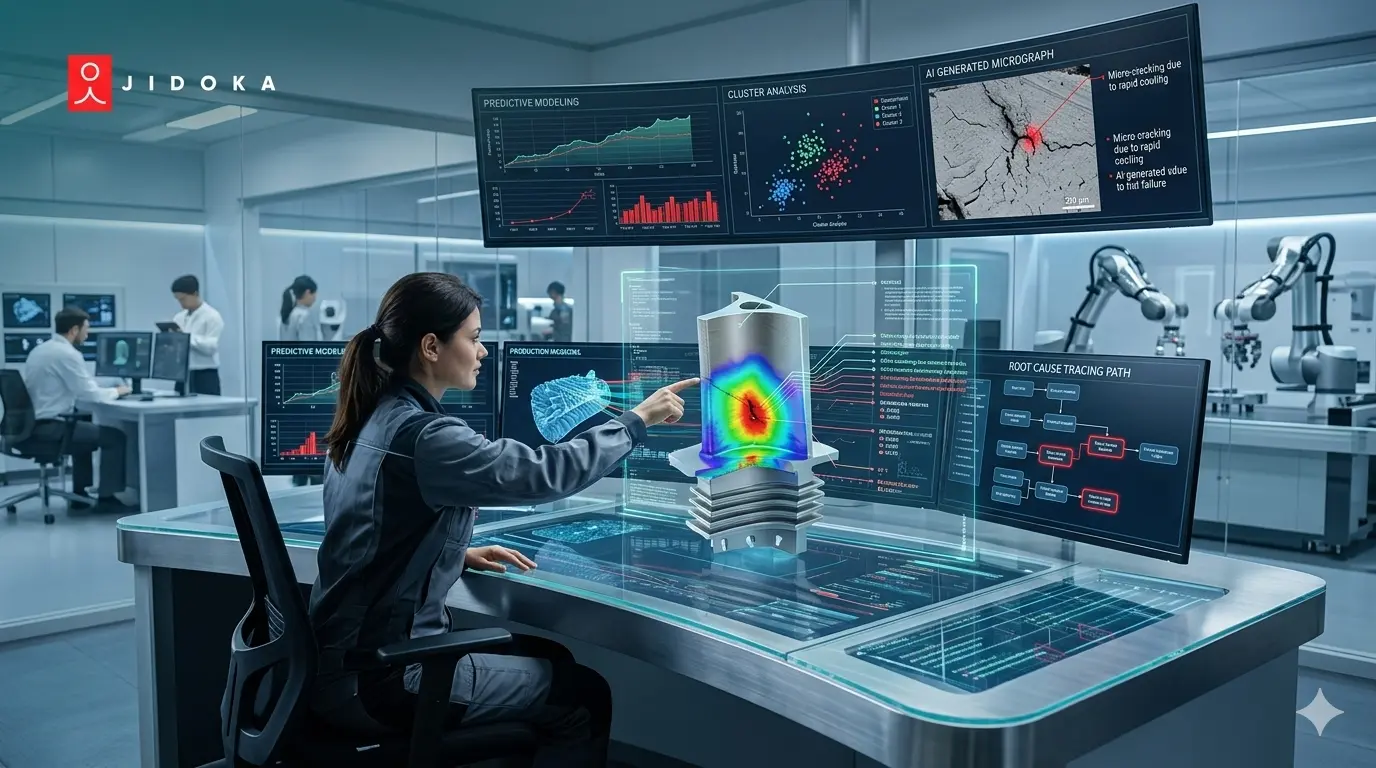
Layer 3: AI Vision Inspection Classification
KOMPASS operates at Layer 3, providing 100% inline inspection and classifying every defect event with structured data: defect type, severity, lot code, line ID, timestamp, and annotated image. This classification output feeds the Layer 4 multivariate models with the quality outcome data they need to learn the relationship between process parameter deviations (Layer 1) and defect production (Layer 3).
NAGARE operates at the Layer 3 to Layer 4 boundary, providing process compliance event data: whether operators followed the correct production sequence at each step, whether SOPs were executed in the specified order, and where deviations occurred. This operator execution data is the fourth quality prediction manufacturing input that sensor and vision data alone cannot provide.
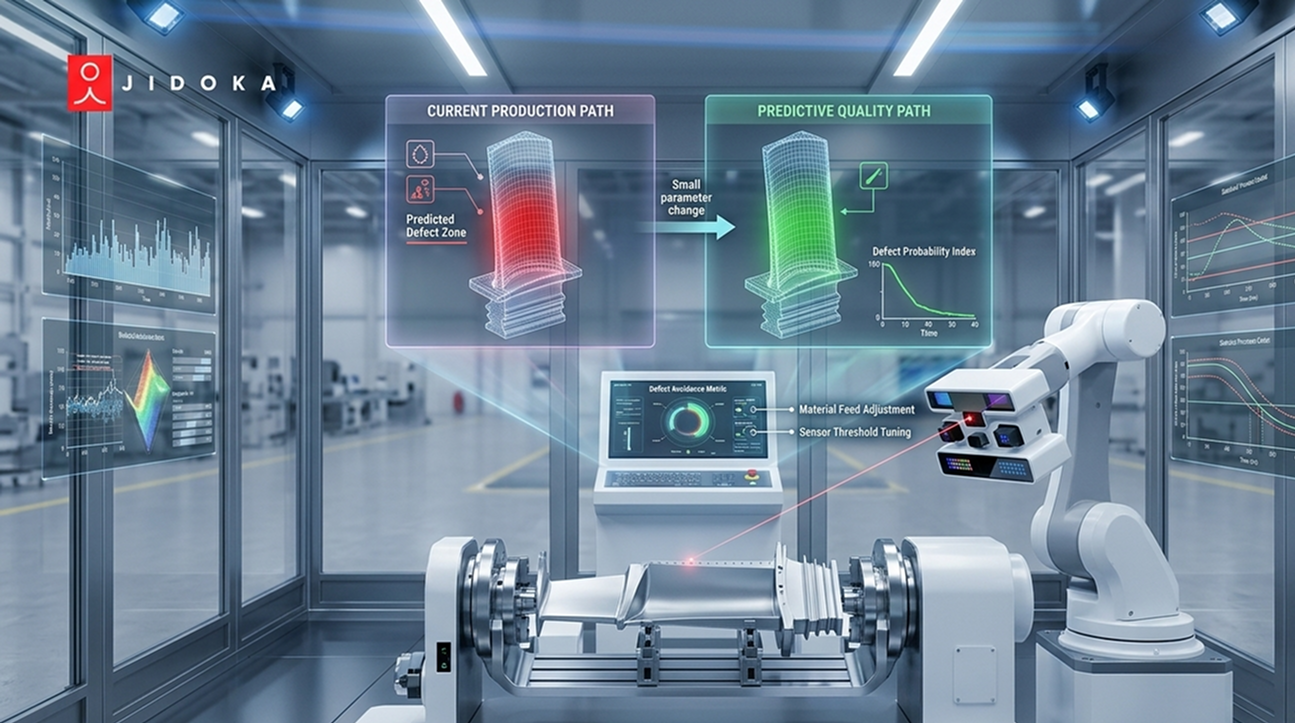
Layer 4: Multivariate Correlation and Predictive Risk Models
Layer 4 combines all three lower layers into a multivariate model that generates a quality risk score per production cycle. The model correlates specific combinations of parameter values (Layer 1), SPC trend signals (Layer 2), historical defect classification patterns (Layer 3), and process compliance data (NAGARE) to predict when a defect is likely to be produced before it appears in the inspection output.
This is where data driven quality prediction becomes a true prevention mechanism: the alert fires on a process signal, before the defect is made, giving operators or automated systems time to correct the deviation. Layer 4 requires at least six months of combined process and quality data to train a reliable model. That is when the system shifts from proactive quality management AI in concept to prevention in practice.
How to Implement a Predictive Quality Control System in Four Stages
A structured four-stage predictive quality control implementation reaches full multivariate prediction capability in 6 to 9 months. The first measurable benefit, real-time SPC alerts on priority process parameters, appears within 6 to 10 weeks of Stage 2 deployment. Full predictive quality system functionality requires the complete data history that Stages 3 and 4 generate.
Stage 1: Process Baseline Collection (Weeks 1 to 6)
Define the scope: which production stations carry the highest defect frequency or scrap cost. Install IIoT sensors on priority parameters at those stations. Connect sensor outputs to a data collection platform and begin logging process parameter readings against lot records and shift schedules. The baseline data collection period defines the normal operating range for every parameter, the foundation of SPC control chart calibration in Stage 2.
Stage 1 delivers immediate process visibility: for the first time, quality teams see what parameters were running at the moment a defect batch was produced. That retrospective visibility is the first step toward prevention, even before the predictive model is built.
Stage 2: SPC Integration (Weeks 4 to 10)
Configure control charts per parameter per station using the baseline data from Stage 1. Set UCL, LCL, and action limits. Configure Western Electric rule detection for CUSUM and EWMA signals. Train shift supervisors on alert interpretation and escalation response. This stage produces the first preventive quality decision: a process adjustment triggered by a parameter trending toward the control limit rather than waiting for a defect to appear.
Stage 3: AI Vision Data Integration (Weeks 8 to 16)
Deploy KOMPASS AI vision inspection and configure NAGARE process monitoring at the stations covered by Stage 2 SPC. Time-synchronize inspection event timestamps with sensor reading timestamps so that Layer 4 can correlate process conditions (what the sensors saw) with quality outcomes (what KOMPASS classified) within the same time-series environment. This cross-layer data linkage is what makes prevention possible: the model learns the relationship between parameter deviation patterns and specific defect types.
Stage 4: Multivariate Model Training and Deployment (Months 4 to 9)
Train the multivariate correlation model on the combined Layer 1 to 3 data history from Stages 1 through 3. Validate prediction accuracy against held-out production data. Deploy quality risk scores per production cycle as live alerts. Configure automated process response triggers: parameter adjustment recommendations, line speed modulation signals, or automated SPC action alerts routed to the shift supervisor in real time.
Deploy NAGARE for Stage 4 process compliance verification: the corrective SOP loaded in response to a quality risk alert should be verified as followed on every subsequent cycle, closing the prevention loop completely [VERIFY: jidoka-tech.ai/products/nagare]. Manufacturers implementing AI-based predictive quality control report 200 to 300% ROI from defect reduction, scrap cost savings, and faster CAPA cycles, with payback periods of 6 to 18 months (tech-stack.com AI Adoption Manufacturing, March 2026).
The Five Impact Metrics That Confirm Predictive Quality Control Is Delivering
Five metrics confirm that the prevention architecture is working: scrap rate trending down, defect rate reduction against the SPC baseline, detection speed improvement, total ROI compounding across three channels, and process deviation correction time decreasing as Stage 4 models mature.
Scrap Rate and Defect Rate Reduction
Manufacturers report up to 40% waste reduction when AI quality monitoring replaces reactive inspection as the primary quality control mechanism (AI Innovate, February 2026). SPC integration with process parameter monitoring delivers 20 to 40% defect reduction compared with inspection-only approaches (Oxmaint SPC Guide, April 2026). Both metrics should be tracked by defect category, not in aggregate. A 30% overall defect rate reduction that leaves the top three defect categories unchanged has not solved the root causes.
Detection Speed and Process Correction Time
AI defect detection at 99%+ accuracy operates 10x faster than human inspection (Hashmeta AI Manufacturing Guide). But the more important speed metric for this approach is process correction time: how many minutes between a Layer 2 SPC alert and a process adjustment that brings the parameter back within control limits. As Stage 4 models mature, this interval should decrease because the model fires earlier in the deviation curve.
ROI Across Three Compounding Channels
The 200 to 300% ROI manufacturers report from AI-based predictive quality control comes from three simultaneous channels: scrap cost elimination (defects prevented rather than scrapped), rework cost elimination (units that never need rework), and CAPA cost reduction (faster root cause resolution because the process data that identifies causes is already collected and structured).
These three channels compound because they reduce the same production cost at three different stages. A proactive AI quality system that prevents the defect eliminates all three costs at once.
Conclusion
The quality manager with a 96% first-pass yield is managing a system that finds defects efficiently, not one that prevents them. The 4% waste has already consumed its full manufacturing cost before inspection touches it.
AI quality infrastructure delivers 200 to 300% ROI through AI-driven quality prevention because the financial return of prevention compounds across scrap, rework, and CAPA frequency simultaneously.
See how KOMPASS and NAGARE anchor the data layers your quality prevention system needs at jidoka-tech.ai/products/kompass.
Frequently Asked Questions
1. What Is Predictive Quality Control in Manufacturing?
Predictive quality control is a manufacturing quality approach that monitors process parameters, sensor data, and AI vision inspection outputs simultaneously to detect the conditions that produce defects before any non-conforming units are made. Unlike reactive inspection, which finds defects after production, predictive quality control acts on process signals at the point of deviation, preventing defect production rather than detecting it. The system combines IIoT sensors, SPC control charts, AI vision classification, and multivariate correlation models.
2. How Is Predictive Quality Control Different From Statistical Process Control?
Statistical Process Control (SPC) is one of the data layers inside a predictive quality control system, not a synonym for it. SPC monitors process measurements over time using control charts to detect when a process is trending out of control. Predictive quality control integrates SPC signals with AI vision inspection data, process parameter feeds, and multivariate correlation models to generate a quality risk prediction before control chart limits are breached, going further than traditional SPC by detecting combinations of conditions that precede defects.
3. What Data Does a Predictive Quality System Need to Work?
A predictive quality system requires four types of continuous, structured data: real-time process parameter readings from IIoT sensors, SPC control chart data with trend detection, AI vision inspection classification outputs at production speed, and process compliance data showing whether operators are following SOPs at each production step. Each data type addresses a different mechanism of defect production. Data driven quality prediction accuracy depends on all four data types being present and time-synchronized.
4. How Long Does It Take to Implement a Predictive Quality Control System?
A structured four-stage predictive quality implementation takes 6 to 9 months to reach full multivariate prediction capability, starting from process baseline collection through SPC integration, AI vision data integration, and multivariate model training. The first benefits, real-time SPC alerts on priority parameters, are visible within 6 to 10 weeks of Stage 2 deployment. Full risk scoring requires at least six months of combined process and defect data to train a reliable model.
5. What ROI Can Manufacturers Expect From Predictive Quality Control?
Manufacturers implementing AI-based predictive quality control report 200 to 300% ROI from defect reduction, scrap cost savings, and faster CAPA cycles, with payback periods of 6 to 18 months for mid-to-large facilities. The financial return compounds across three channels: scrap cost elimination (defects prevented), rework cost elimination (units that never require rework), and CAPA cost reduction (faster root cause resolution with better process data). Source: tech-stack.com AI Adoption in Manufacturing, March 2026.