Machinebewaking in de productie kent een hiaat waar niemand tijdens verkoopdemonstraties over praat. Je machinebewakingssysteem rapporteert een OEE van 76%. De spil heeft de hele dienst gedraaid. De cyclustijden zagen er normaal uit. Vervolgens ontdekt je supervisor dat een koppelstap bij station 3 is overgeslagen. Zestig onderdelen verder groeit de stapel met afgekeurde producten.
De wereldwijde markt voor machinebewakingsoplossingen bedraagt $3,78 miljard in 2025 . Het grootste deel van die uitgaven legt vast wat machines rapporteren. Niet wat er daadwerkelijk op de werkvloer gebeurt.
Machinebewaking is het geautomatiseerd en continu vastleggen van de machinestatus, cyclustijd, stilstand, OEE en conditiesignalen, live weergegeven voor operators en supervisors. Het vervangt het handmatig bijhouden van lijsten aan het einde van de dienst door data waar je tijdens dezelfde productieperiode direct op kunt acteren.
Deze gids legt de drie verbindingsmethoden uit, de acht statistieken die het waard zijn om te volgen, en waar real-time machinebewaking stopt en proceszichtbaarheid begint.
Wat machinebewaking meet en de laag die het niet kan zien
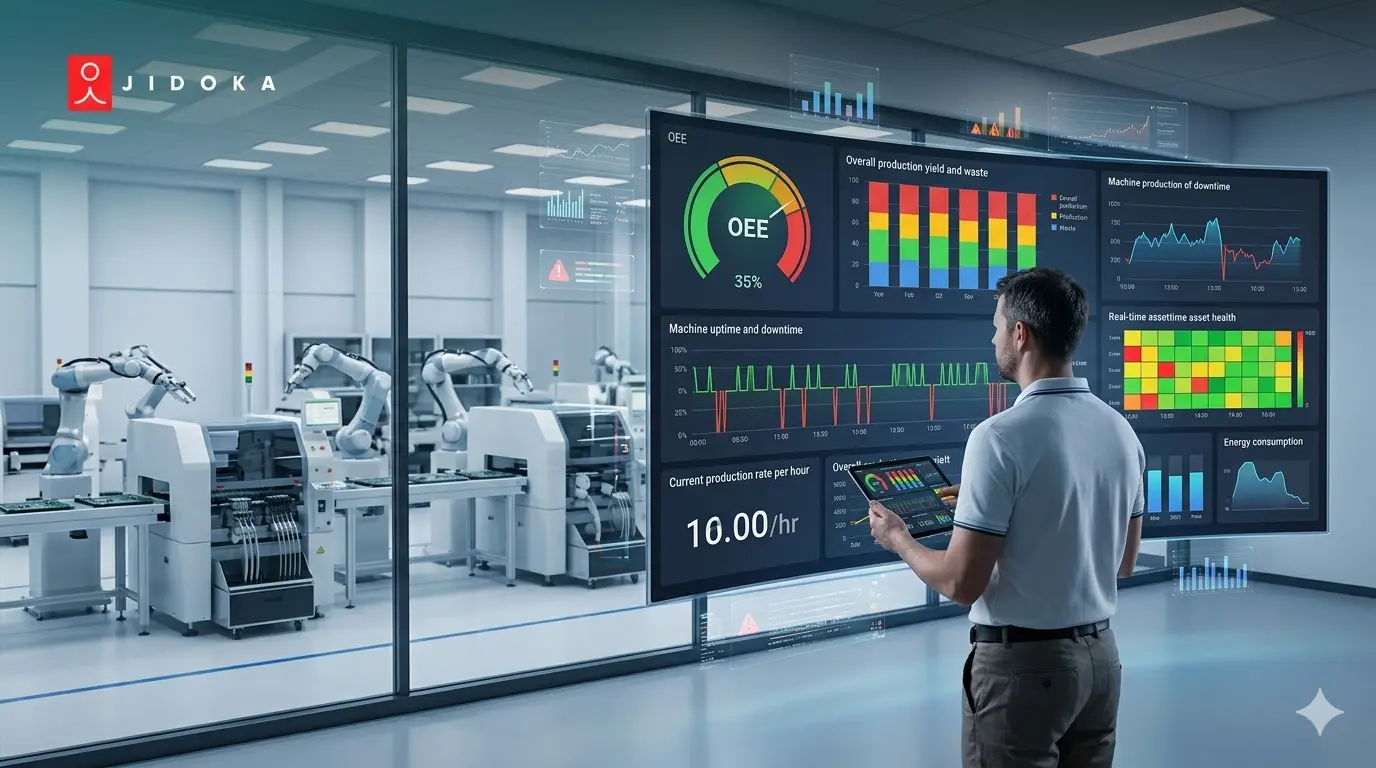
Machinebewaking geeft je een live feed van je machines. Bedrijfsstatus, cyclusaantal, stilstandduur, OEE onderverdeeld in de drie componenten. Die data is accuraat. Het probleem is de reikwijdte ervan.
Een machinebewakingssysteem rapporteert machinegedrag, geen menselijk gedrag. Dat zijn twee verschillende dingen, en het verwarren van die twee is de reden waarom de meeste implementaties van bewakingssystemen vastlopen.
Wat het ziet:
- Draai-/stopstatus en beschikbaarheid ten opzichte van de geplande tijd
- Prestatiegraad versus geprogrammeerde nominale snelheid
- Conditiebewakingssignalen van apparatuur: trillingen, temperatuur, stroomverbruik
- Ongeplande stopmomenten, gelogd met tijdstempels
Wat het niet kan zien:
- Of de operator de juiste montagesequentie heeft voltooid
- Of het juiste onderdeel is geïnstalleerd
- Of een processtap volledig is overgeslagen
Meer dan 64% van de industriële faciliteiten gebruikt inmiddels systemen voor machinebewaking, maar bijna de helft heeft nog steeds geen inzicht op procesniveau.
Machinesensoren rapporteren wat er heeft gedraaid. Ze rapporteren niet wat er correct is uitgevoerd. Dat onderscheid vormt de basis voor de monitoringstack in het volgende gedeelte.
De monitoringstack: drie lagen van inzicht in productie
Eén enkel systeem voor machinebewaking geeft je geen volledig beeld van de productie. Het geeft je Laag 1. Er zijn nog twee lagen daarboven, en de verliezen die in die lagen verborgen zitten, zie je niet terug op een OEE-dashboard.
Laag 1: Machinebewaking
Dit is wat de meeste systemen voor machinebewaking standaard bieden. De machine rapporteert beschikbaarheid, OEE, aantal cycli, stilstandduur en prestatiegraad ten opzichte van de geprogrammeerde nominale snelheid. Gegevens zijn afkomstig van PLC-signalen, IoT-sensoren of protocollen zoals MTConnect, OPC-UA en Fanuc Focas.
Wat het mist: alles wat niet als machinegebeurtenis wordt geregistreerd. Een CNC die op 85% van de nominale voedingssnelheid draait, ziet er prima uit. Een station dat een aandraaistap overslaat, ziet er ook prima uit. Laag 1 registreert beide niet.
Laag 2: Conditiebewaking
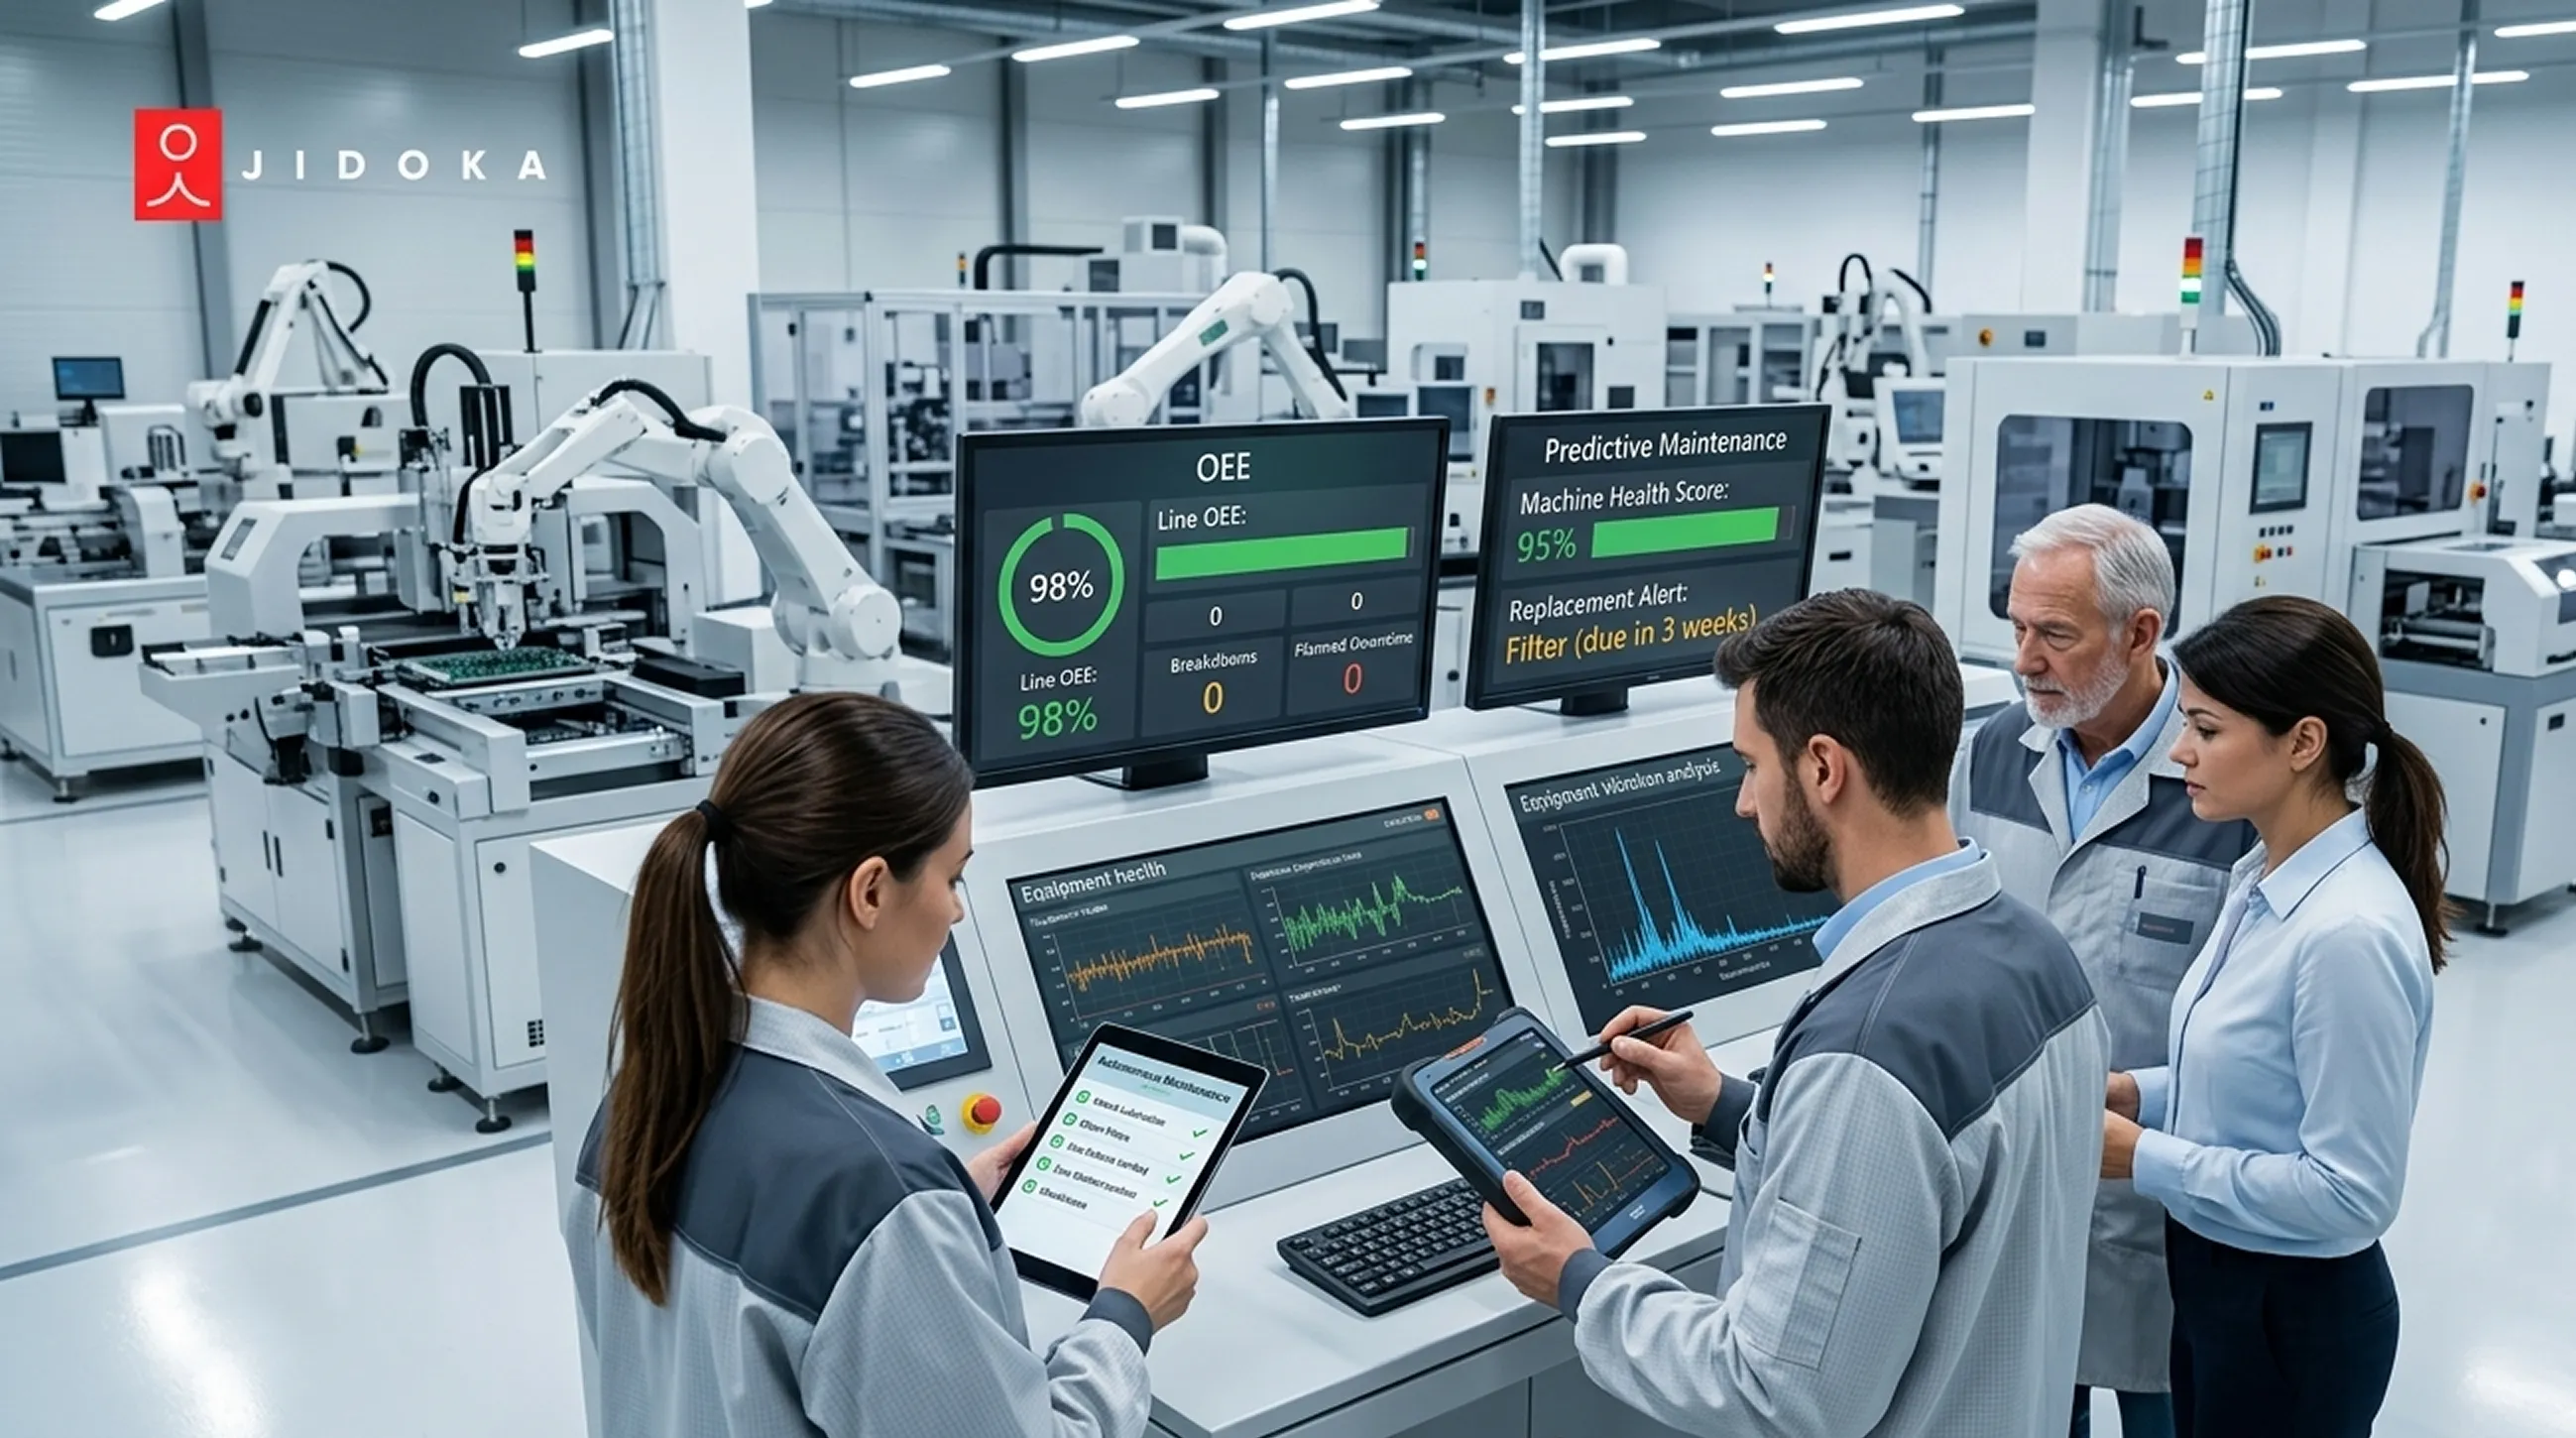
Dit is de laag voor fysieke gezondheid. Trillingsversnellingsmeters, lagertemperatuursensoren, stroomtangen en akoestische emissiedetectoren worden op de machinebehuizing geplaatst zonder de PLC aan te raken. Ze vangen lagerfoutfrequenties, thermische gradiënten en akoestische signalen op die 48 tot 96 uur voorafgaan aan een defect.
Trillingsbewaking is verantwoordelijk voor meer dan 75% van de industriële toepassingen voor conditiebewaking wereldwijd. Laag 2 vertelt je dat de machine achteruitgaat. Het kan je nog steeds niet vertellen wat de operator bij station 3 heeft gedaan.
Laag 3: Proces- en operatorbewaking
Dit is de laag die het gat dicht. AI-gestuurde camera's analyseren acties van operators frame voor frame aan de hand van een digitale SOP, waarbij de aanwezigheid van onderdelen, de montagesequentie en de timing van stappen in realtime worden bevestigd. Statistische studies in de automobiel-, elektronica- en voedingsmiddelenindustrie tonen consistent aan dat menselijke inspecteurs onder optimale omstandigheden tussen de 70% en 85% van de defecten opmerken, waarbij dat cijfer scherp daalt tijdens nachtdiensten en aan het einde van een dienst.
Laag 3 is waar herbewerking ontstaat, en het is de laag die geen enkel machinesignaal kan dekken.
De juiste methode voor het verbinden van je machines hangt volledig af van welke laag je wilt aanpakken, en dat is wat in het volgende gedeelte wordt behandeld.
Drie methoden voor het verbinden van machines: protocol, sensor en visie
Je machinepark is divers. Sommige machines hebben Fanuc-controllers. Sommige zijn draaibanken uit de jaren 90 zonder digitale output. Sommige zijn assemblagestations waar de operator de variabele is. Elke implementatie van machinebewaking begint met dezelfde vraag: welke verbindingsmethode past bij welk bedrijfsmiddel? Kies de verkeerde en je krijgt blinde vlekken, verspild budget of beide.
Methode 1: Protocol-gebaseerd (MTConnect, OPC-UA, Fanuc Focas, Siemens SINUMERIK)
Dit is de meest uitgebreide vorm van cnc-machinemonitoring die beschikbaar is. Het monitoringsysteem leest direct uit de besturing: spilbelasting, asgebruik, M-code status, feed override, alarmcodes en de werkelijke versus geprogrammeerde cyclustijd. De data is afkomstig van de besturing zelf, niet op basis van afgeleide externe signalen.
Beperking: werkt alleen op machines met compatibele besturingen. Oudere apparatuur blijft buiten schot.
Methode 2: IoT-sensor-gebaseerd (stroomtangen, trilling, optisch)
Conditiemonitoring van apparatuur via externe sensoren vereist geen aanpassingen aan de PLC en geen productiestop. Stroomtangen en trillingssensoren worden op de machinebehuizing bevestigd en leiden de status (draaien/stilstaan) af uit elektrische en mechanische signalen. Werkt op elke machine van elk bouwjaar: handmatige freesmachines, lintzagen, spuitgietmachines, draaibanken van 30 jaar oud.
IoT-gestuurd voorspellend onderhoud vermindert storingen met wel 70% en verlaagt onderhoudskosten met 25%. Een typische implementatie voor real-time machinemonitoring in een fabriek duurt 48 uur zonder onderbreking van de productie.
Beperking: kan geen G-code, werkstukprogramma's of native kwaliteitsdata uitlezen.
Methode 3: Vision-gebaseerd (Edge AI + inspectiecamera voor productielijnen)
Een inspectiecamera voor productielijnen in combinatie met edge AI dekt laag 3 van de monitoringstack. Het legt frame voor frame de acties van de operator, de plaatsing van onderdelen, de montagesequentie en maatcontroles vast. Dit zijn de procesfouten die geen enkel machinesignaal kan waarnemen.
Beperking: vereist camerapositionering en AI-model-training per station. Geen vervanging voor conditiemonitoring op spilniveau.
De juiste aanpak voor een gemengd machinepark
Protocolintegratie voor CNC-machines die dit ondersteunen. IoT-sensoren voor verouderde apparatuur. Een inspectiecamera voor productielijnen bij proceskritieke werkstations. Die combinatie zorgt voor volledige dekking van machinemonitoring op de gehele werkvloer, zonder dat één methode aan elk bedrijfsmiddel wordt opgedrongen.
Verbindingsmethode geregeld. Volgende stap: de acht statistieken die laten zien of het ook echt werkt.
De 8 statistieken voor machinemonitoring die verbeterbeslissingen sturen
Elke leveranciersdemo begint met OEE. Dat getal is belangrijk, maar een enkel percentage vertelt een bedrijfsleider niet waar hij moet ingrijpen. Deze acht statistieken zijn wat ervaren engineers daadwerkelijk bijhouden in een machinemonitoringsysteem — gerangschikt op operationele impact, niet op alfabetische volgorde.
1. OEE (Overall Equipment Effectiveness)
De belangrijkste statistiek. Beschikbaarheid × Prestatie × Kwaliteit. Het wereldwijde gemiddelde in de discrete productie ligt in 2025 op ongeveer 68%, een stijging ten opzichte van 58% in 2020. Slechts 6% van de fabrikanten haalt structureel 85% of hoger. Een verbetering van 10 punten in de OEE bij een productiefabriek van $50 miljoen levert ongeveer $5,5 miljoen aan extra doorvoer op, zonder kapitaalinvesteringen.
2. Beschikbaarheidsgraad
Geplande tijd versus werkelijke draaitijd. Een lage score wijst direct op ongeplande stilstand of overmatige omsteltijden. Dit is het eerste getal om te onderzoeken wanneer real-time machinebewakingsdashboards laten zien dat de OEE tijdens een dienst daalt.
3. Prestatiegraad
Werkelijke cyclustijd versus geprogrammeerde nominale snelheid. Handmatige OEE-registratie overschat de prestaties met 8 tot 12 procentpunten in vergelijking met geautomatiseerde metingen. Een CNC-machinebewakingssysteem ziet wanneer een machine op 85% van de nominale voedingssnelheid draait. Een rondgang met een klembord zal dat nooit opmerken.
4. Kwaliteitsgraad
Goede onderdelen versus totale output, geregistreerd op machineniveau. Het aggregeren van uitval aan het einde van de dienst verhult welke machine en welke operator het probleem heeft veroorzaakt.
5. Omsteltijd
Van het begin van de setup tot de bevestiging van het eerste goede onderdeel. Fabrieken die zich richten op SMED houden dit apart bij in hun machinebewakingssysteem, omdat het een gepland verlies is en geen defect. Het verbergen hiervan in de beschikbaarheid vertekent beide cijfers.
6. MTBF (Mean Time Between Failures)
Een dalende MTBF-trend bij een specifiek bedrijfsmiddel is het vroegste signaal dat conditiebewaking van apparatuur moet leiden tot een conditiebeoordeling. Wachten op een defect kost aanzienlijk meer dan anticiperen op de trend.
7. MTTR (Mean Time To Repair)
Geautomatiseerde gebeurtenisdetectie verlaagt de MTTR met 30 tot 50% bij gedetecteerde storingsmodi, waarbij de terugverdientijd voor edge-hardware doorgaans 2 tot 6 maanden bedraagt. Een lange MTTR wijst bijna altijd op problemen met de beschikbaarheid van onderdelen of de planning van technici, niet op de complexiteit van de machine.
8. Productie versus planning
Werkelijke output afgezet tegen het productieschema. De meest bruikbare metriek voor een ploegleider. Machinebewaking maakt dit real-time inzichtelijk in plaats van pas tijdens de nabespreking aan het einde van de dienst, wanneer er niets meer te herstellen valt.
Deze acht statistieken laten zien waar de verliezen zitten. Hierna bespreken we wat CNC-machinebewaking specifiek mogelijk maakt voor bewerkingscentra, waar de data aanzienlijk dieper gaat.
CNC-machinebewaking: specifieke installatieoverwegingen voor bewerkingscentra
Algemene machinebewaking dekt de draai-/stopstatus en OEE. CNC-machinebewaking gaat dieper. Een bewerkingscentrum met een compatibele besturing levert data die geen enkele externe sensor kan evenaren. Dit is hoe dat er in de praktijk uitziet en waar de beslissingen over de installatie werkelijk liggen.
1. Protocolgegevens beschikbaar vanuit de besturing
CNC-machinemonitoring via Fanuc Focas, MTConnect of Siemens SINUMERIK geeft inzicht in de spilbelasting, asbenutting, feed override-instellingen, M-code-status, alarmcodes en de werkelijke versus geprogrammeerde cyclustijd. Dit is de besturing die direct communiceert. Geen aannames, geen schattingen.
2. Spilconditie via conditiemonitoring
Trillingsversnellingsmeters op het spilhuis detecteren defectfrequenties van lagers en thermische gradiënten. AI-gestuurd voorspellend onderhoud zorgt voor een afname van 70 tot 75% in ongeplande stilstand en een verbetering van 10 tot 20% in OEE bij CNC-verspaningsprocessen. De meeste platforms voor conditiemonitoring van apparatuur voorspellen spilfalen 48 tot 96 uur van tevoren met een nauwkeurigheid van meer dan 85%.
3. Het probleem van micro-stops
Dit is waar de meeste implementaties van CNC-machinemonitoring voor het eerst voor een verrassing komen te staan. Stops van vier tot zeven seconden voor spaanafvoer, gereedschapswissels of het resetten van de aanvoerautomaat zijn te kort om handmatig te registreren. Ze stapelen zich op tot 10 à 15% van de beschikbare productietijd. Alleen real-time machinemonitoring legt deze vast.
4. Hoe de cijfers eruitzien vóór implementatie
De gemiddelde OEE in kleine tot middelgrote CNC-werkplaatsen ligt tussen de 30 en 60%. Een pilot met 3 tot 10 machines verbetert de OEE doorgaans met 5 tot 15% en vermindert ongeplande stilstand met 20 tot 50% binnen 3 tot 6 maanden. De kosten voor hardware en integratie bedragen $500 tot $2.500 per machine, met SaaS-kosten van $50 tot $300 per machine per maand. De meeste bedrijven rapporteren een terugverdientijd van 3 tot 12 maanden.
CNC-machinemonitoring biedt de meest gedetailleerde data op machineniveau die beschikbaar is. Wat het echter niet kan bieden, is inzicht in wat er op het werkstation gebeurt nadat de spil is gestopt.
Waar AI-cameramonitoring het gat dicht dat machinedata niet kan dichten
Uw machinemonitoringsysteem bevestigde dat de spil draaide. De cyclustijd was nominaal. De OEE zag er goed uit. Maar de stapel afgekeurde onderdelen bij de eindcontrole vertelde een ander verhaal. Dat is het Layer 3-gat: de afstand tussen wat de machine rapporteerde en wat er daadwerkelijk op het werkstation gebeurde. Een inspectiecamera voor productielijnen, aangedreven door edge-AI, is de enige oplossing die dit gat dicht.
1. Het procesfalen dat machinesensoren niet zien
Machinemonitoring bevestigt dat een machine op de juiste snelheid draaide en output leverde. Het kan niet bevestigen of de operator het juiste onderdeel heeft geïnstalleerd, het juiste koppel op de juiste bevestiging heeft toegepast of de montagereeks in de juiste volgorde heeft uitgevoerd.
Menselijke inspecteurs vangen onder optimale omstandigheden tussen de 70% en 85% van de defecten op, waarbij dat aantal scherp daalt tijdens nachtdiensten en aan het einde van een dienst. Dit zijn de fouten die leiden tot herbewerking, retourzendingen van klanten en garantieclaims.
2. Wat AI-visionmonitoring toevoegt op Layer 3
Een inspectiecamera voor productielijnen met edge-AI voert real-time stapsgewijze verificatie uit aan de hand van een digitale SOP. Het bevestigt wat er is gedaan en in welke volgorde, niet alleen of de machine een cyclus heeft doorlopen. Diezelfde frame-voor-frame analyse detecteert procesafwijkingen op het moment dat ze plaatsvinden, in plaats van bij een audit aan het einde van de dienst.
3. Nagare door Jidoka Technologies
Nagare zet bestaande RTSP- en IP-compatibele camera's (Bosch, Hikvision en andere) om in een live real-time machinemonitoringsysteem voor procesnaleving. In de meeste installaties is geen nieuwe hardware vereist.
Het draait twee gelijktijdige streams on-premises via edge-AI zonder afhankelijkheid van de cloud:
- Stream 1 (objectdetectie): bevestigt de aanwezigheid van onderdelen, de juiste bout op de juiste positie
- Stream 2 (actieherkenning): bevestigt de beweging van de operator, het koppel is aangebracht en niet alleen geplaatst
Nagare zorgt voor een verbetering van 30% in procesnaleving, een vermindering van 35% in herbewerking en een daling van 25% in stilstandtijd. Het volgt 100% van de montagestappen via de bestaande camera-infrastructuur. Skeleton tracking monitort de acties van de operator zonder gezichtsherkenning, waardoor de identiteit van de operator privé blijft.
Een complete stack voor machinebewaking die alle drie de lagen dekt, geeft u inzicht in de werkelijke productie. Laag 1 en 2 bieden u nauwkeurige OEE. Laag 3, gedekt door een inspectiecamera aan de productielijn die gebruikmaakt van edge AI, vertelt u of het werk correct is uitgevoerd.
Conclusie
De meeste fabrikanten die tegenwoordig een systeem voor machinebewaking gebruiken, hebben Laag 1 gedekt. Ze beschikken over OEE-dashboards, stilstandlogboeken en cyclustijdrapporten. De data is accuraat. Het probleem is dat de werkvloer niet stopt met het genereren van verliezen bij de grens van wat machinesensoren kunnen zien.
Overgeslagen montagestappen, verkeerde onderdelen, werk in de verkeerde volgorde: niets hiervan wordt geregistreerd op een dashboard voor machinebewaking. Die herbewerking komt pas aan het licht bij de eindinspectie, of erger nog, bij de klant.
Jidoka Technologies' Nagare verbindt uw bestaande camera's met de enige laag die de meeste implementaties van machinebewaking volledig onbelicht laten. De data was er altijd al. Nu is deze bruikbaar.
Laten we contact opnemen met Jidoka en uw bestaande camera-infrastructuur aan het werk zetten
Veelgestelde vragen
1. Wat is machinebewaking in de productie?
Machinebewaking is het geautomatiseerd en continu vastleggen van de machinestatus, cyclustijd, OEE, stilstandevents en conditiesignalen die live worden weergegeven aan productieteams. Het vervangt de handmatige verwerking aan het einde van de dienst door data waar operators en supervisors binnen hetzelfde productievenster op kunnen acteren.
2. Wat is het verschil tussen machinebewaking en procesbewaking?
Machinebewaking legt vast wat de machine rapporteert: beschikbaarheid, prestaties en OEE. Procesbewaking legt vast wat de operator doet: montagevolgorde, aanwezigheid van onderdelen en staptijden in vergelijking met een digitale SOP. Een compleet zichtbaarheidssysteem heeft beide nodig. De een zonder de ander laat herstelbare verliezen onzichtbaar.
3. Hoe verbind ik verouderde machines zonder PLC met een bewakingssysteem?
Draadloze IoT-sensoren — stroomtangen, trillingsmeters of optische sensoren — worden extern op elke machine bevestigd zonder dat er aanpassingen aan de PLC nodig zijn. Een typische implementatie van real-time machinebewaking in een fabriek met een gevarieerd machinepark duurt 48 uur, zonder onderbreking van de productie, en werkt op apparatuur van elke leeftijd.
4. Welke OEE moet ik nastreven bij het implementeren van machinebewaking?
De veel geciteerde wereldklasse-benchmark is 85%, in 1984 gedefinieerd door Seiichi Nakajima. De meeste discrete fabrikanten die beginnen met machinebewaking zitten op 60 tot 68%. Een realistisch doel voor het eerste jaar is een verbetering van 5 tot 12 punten binnen 6 maanden na implementatie.
5. Kunnen bestaande beveiligingscamera's worden gebruikt voor procesbewaking?
Standaard CCTV neemt beelden op, maar analyseert geen productiegebeurtenissen. Nagare van Jidoka Technologies zet bestaande RTSP- en IP-compatibele camera's om in een live inspectiesysteem voor productielijnen met behulp van on-premises edge AI. Hiermee wordt 100% van de montagestappen gevolgd, meestal zonder dat er nieuwe hardware nodig is.