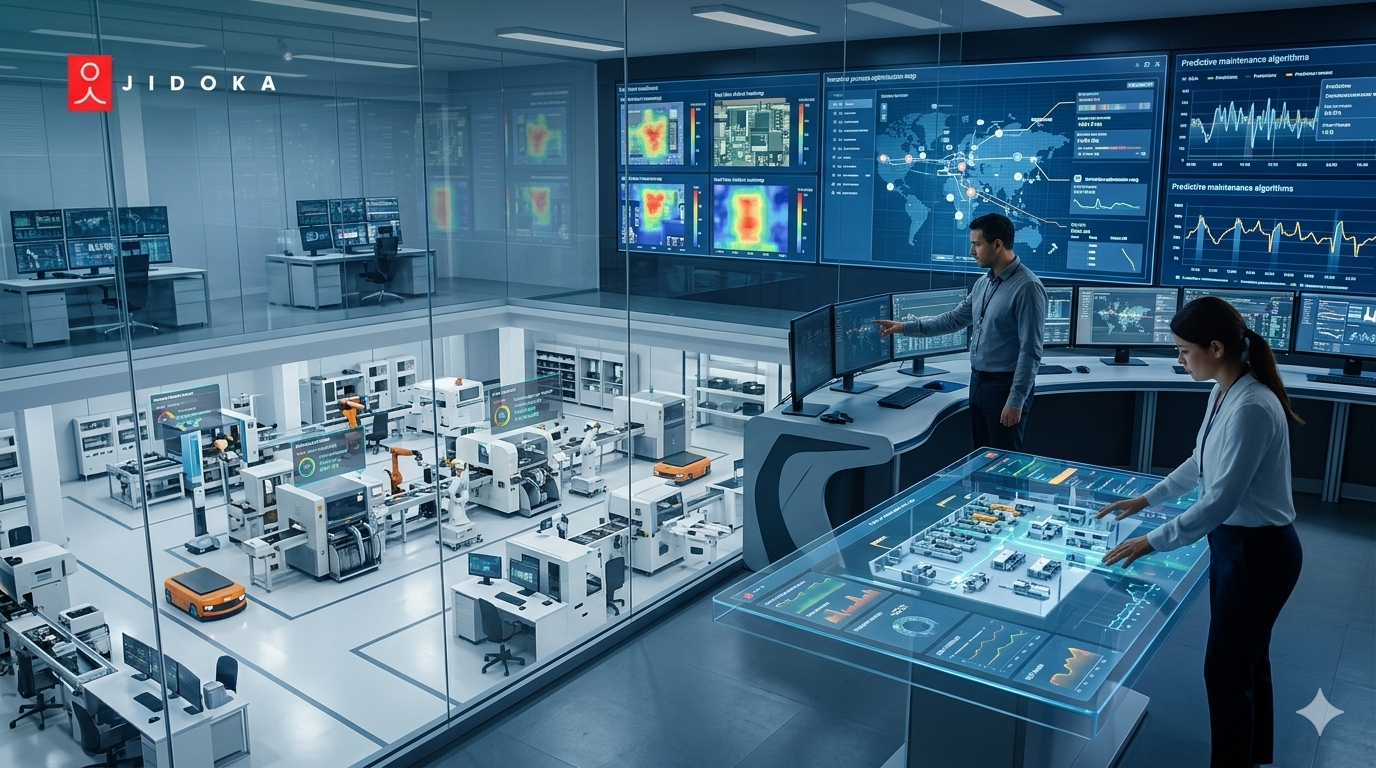
De meeste projecten voor het elimineren van knelpunten in de productie lopen vast bij de inkoop. Men gaat ervan uit dat beter inzicht nieuwe hardware vereist: sensoren, edge-devices, slimme camera's. Dat is niet zo. De data die nodig is om knelpunten in de productie te identificeren en op te lossen, stroomt al door je fabriek.
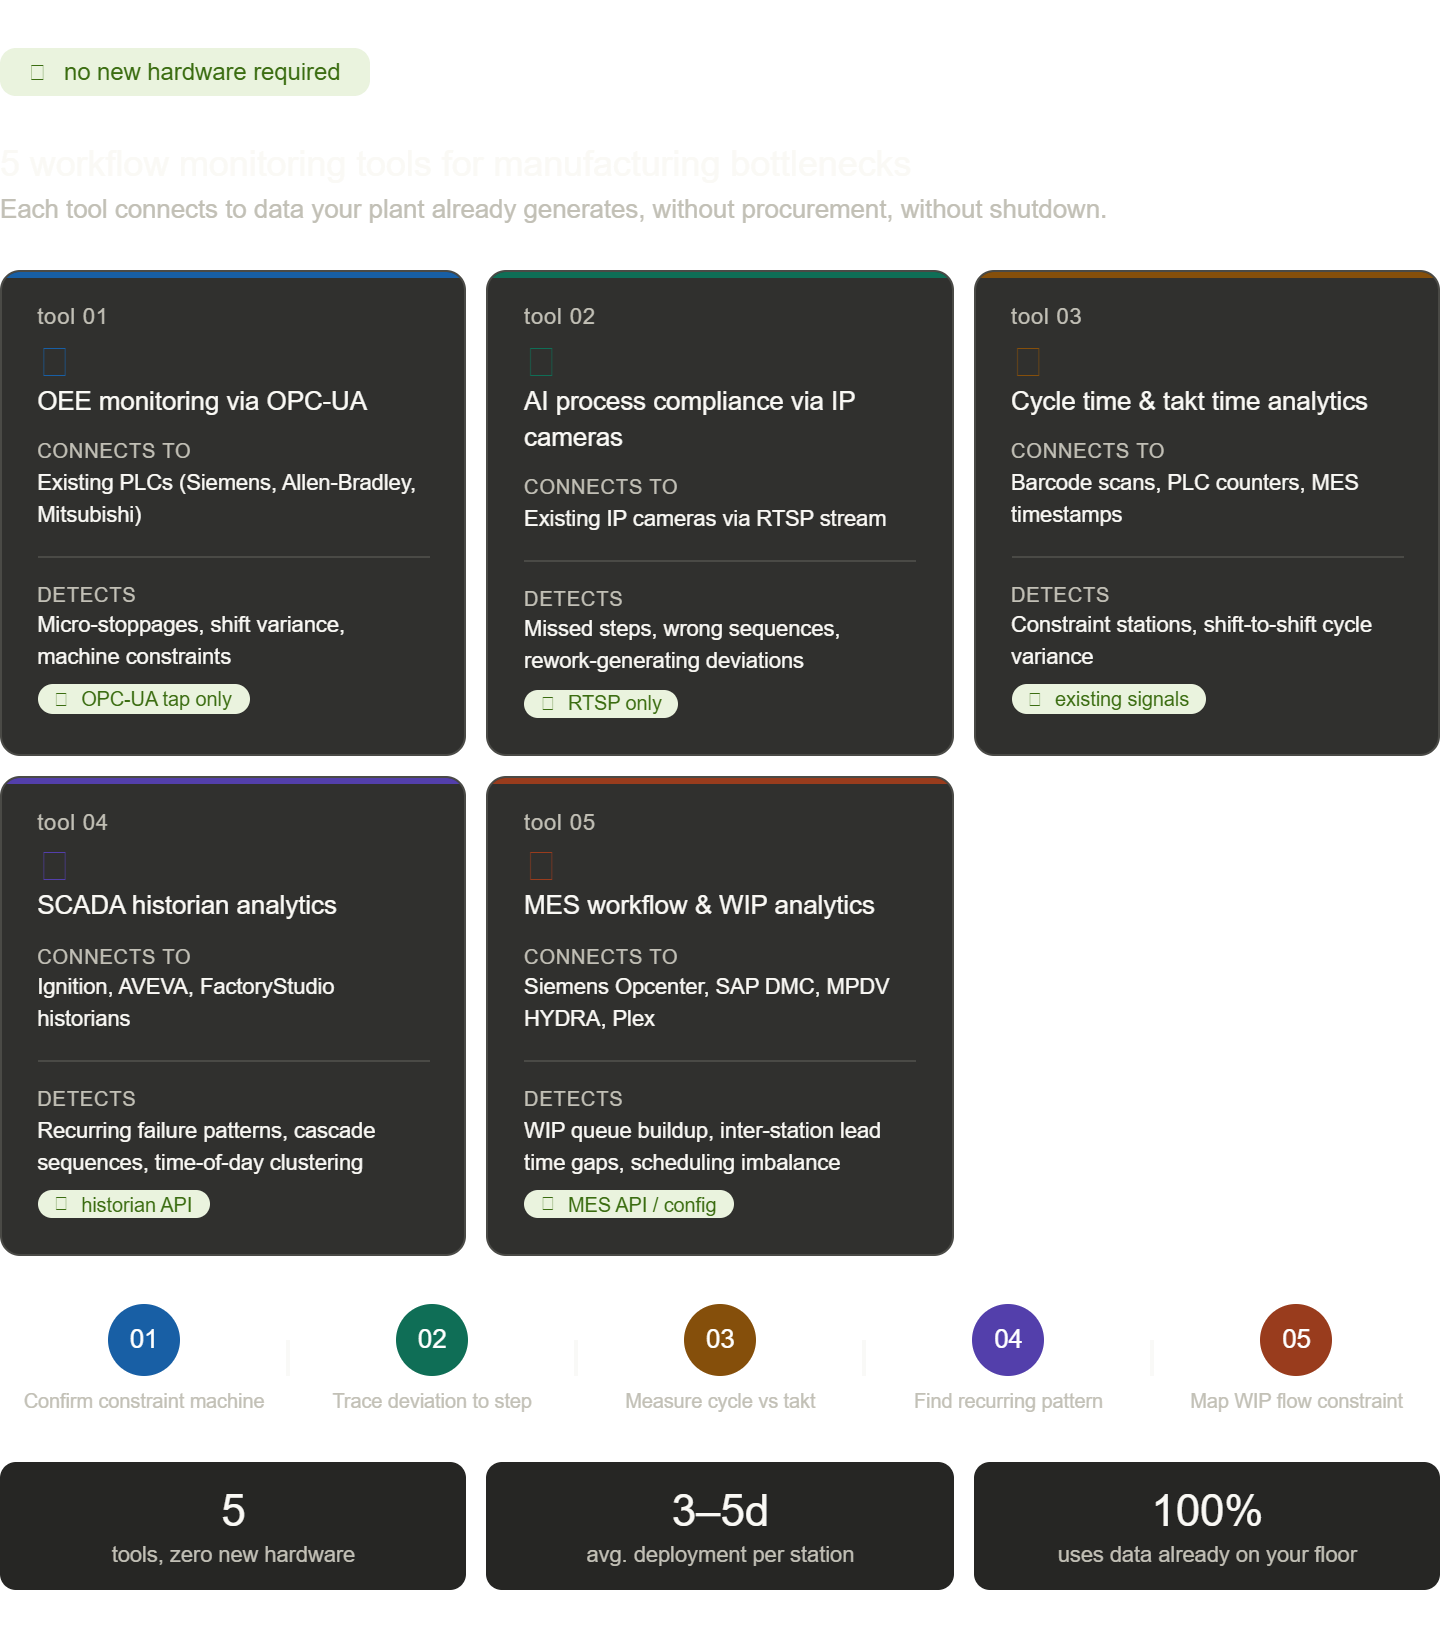
Deze gids zet vijf tools voor workflowmonitoring uiteen die werken met de infrastructuur die er al staat, van bestaande PLC's en IP-camera's tot SCADA-historianlogs en MES-werkorderdata.
1. Real-time OEE-monitoringsoftware met OPC-UA-integratie
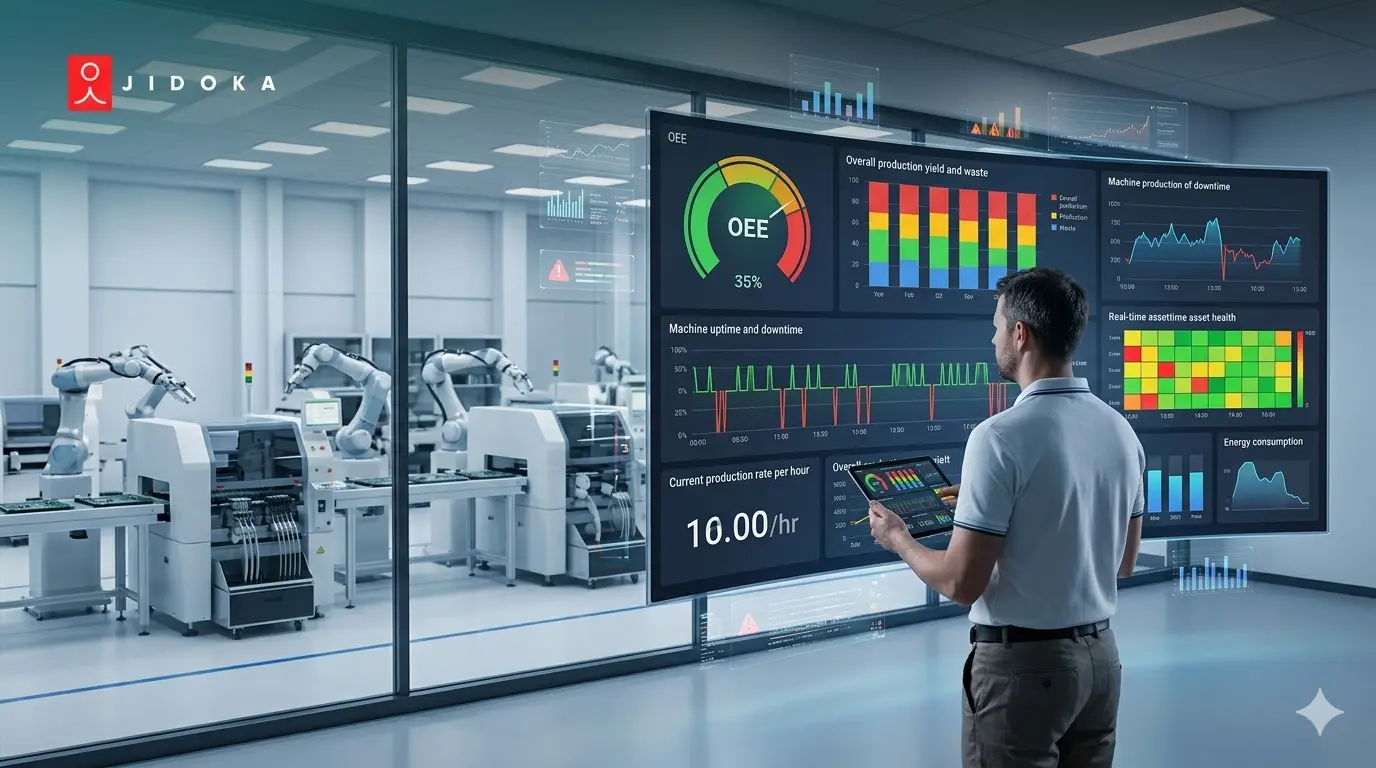
Real-time OEE-monitoringsoftware maakt verbinding met bestaande PLC's via OPC-UA of directe Ethernet-taps, waardoor data over machinebeschikbaarheid, prestaties en kwaliteit bij elk station wordt vastgelegd zonder nieuwe hardware.
Elke moderne PLC van Siemens, Allen-Bradley en Mitsubishi ondersteunt standaard OPC-UA. Die communicatielaag is er al. Workflowmonitoringplatforms zoals MachineMetrics, TeepTrak en Fabrico maken direct verbinding met de bestaande automatiseringsstack en beginnen binnen enkele uren na configuratie met het ophalen van live machinestatusgegevens.
Het inzicht in knelpunten dat dit oplevert, betreft micro-stops. Dit zijn machinestops van 4 tot 12 seconden die geen alarmlogs activeren, niet in ploegrapporten verschijnen en niet worden vastgelegd in handmatige downtime-registraties. Individueel zijn ze onzichtbaar. Geaggregeerd over een hele ploeg verbruiken ze 10 tot 15% van de beschikbare productietijd op een beperkende machine.
Waar moet je op letten in OEE-data
- Beschikbaarheidsgat per station: elke machine die onder de 85% van de geplande productietijd draait, is een bevestigd knelpunt.
- Verschillen tussen ploegen: een machine met 90% OEE tijdens de dagdienst en 74% tijdens de nachtdienst heeft een probleem met procesconsistentie, geen defect aan de apparatuur.
- Clusters van micro-stops: stops die elke 40 tot 50 minuten optreden en 8 tot 12 seconden duren, zijn consistent terug te voeren op materiaaltekorten aan de aanvoerzijde of terugkerende interferentie bij de gereedschappen, niet op mechanische defecten.
De Inefficiencies Zoom-In-module van Fabrico voegt een extra laag toe aan de ruwe data door videoclips van bestaande camera's te synchroniseren met OEE-tijdlijngebeurtenissen, zodat een CI-manager precies het moment van de stop kan bekijken in plaats van dit te moeten reconstrueren op basis van de herinnering van de operator.
Waar OPC-UA niet beschikbaar is op oudere PLC's of legacy CNC's, kunnen stroomsensoren op bestaande voedingslijnen worden geklemd om dezelfde signalen door te geven. Installatietijd: minder dan twee uur per machine. Geen aanpassing van de PLC vereist.
OEE-monitoring is de fundering van elke serieuze opzet voor workflowmonitoring. Zodra je hebt bevestigd welke machine het knelpunt vormt, wordt elke volgende workflowmonitoringtool in deze lijst doelgericht in plaats van verkennend.
2. AI-procesconformiteitsmonitoring via bestaande IP-camera's
AI-procesmonitoringsoftware maakt verbinding met IP-camera's die al boven assemblagestations zijn geplaatst via RTSP, waarbij live videobeelden worden geanalyseerd om elke montagestap te verifiëren aan de hand van een digitale SOP, elke cyclus, elke dienst, zonder nieuwe vision-hardware.
De meeste assemblagevloeren hebben al camera's boven werkstations voor veiligheids- of beveiligingsdoeleinden. Die camera's leggen alles vast, maar zonder een laag voor procesmonitoring verifiëren ze niets. Dat verandert zonder dat de hardware hoeft te worden aangepast.
Het mechanisme is een dual-stream AI-analyse die op edge-compute draait. Eén stream verwerkt objectdetectie: is het juiste onderdeel aanwezig? De tweede verwerkt actieherkenning: heeft de operator de stap in de juiste volgorde voltooid? Beide worden vergeleken met een digitale SOP die in het platform is geladen. Elke afwijking activeert een waarschuwing voordat de eenheid verdergaat in het proces.
Waarom dit specifiek belangrijk is voor het elimineren van knelpunten
Procesafwijkingen leiden niet alleen tot defecten. Ze creëren ook wachtrijen voor herbewerking. Een overgeslagen koppelcontrole bij station 4 komt pas bij station 9 als defect aan het licht. Tegen die tijd is er een batch voor herbewerking ontstaan die stations 10 en 11 vertraagt. OEE-monitoring bij die stroomafwaartse stations zal een daling in beschikbaarheid laten zien. De hoofdoorzaak ligt echter stroomopwaarts in het proces, niet bij de machines zelf.
Dit is het type knelpunt in de productie dat geen enkele OEE-tool zelfstandig kan achterhalen. AI-procesmonitoring herleidt die afwijking tot de exacte stap, dienst en het station waar deze is ontstaan. Dat zijn de gegevens die de cirkel rond maken.
Hoe NAGARE van Jidoka dit levert
NAGARE van Jidoka Technologies voert dual-stream analyse uit (Objectdetectie + Actieherkenning) op edge-units die via RTSP met bestaande camera's zijn verbonden. Het verifieert 100% van de montagestappen bij elke cyclus en genereert afwijkingsrapporten per stap, dienst en operator. De implementatie bij één station duurt 3 tot 5 dagen, inclusief het digitaliseren van de SOP. Er zijn geen nieuwe camera's nodig.
3. Analyseplatforms voor cyclustijd en takt-tijd
Analyseplatforms voor cyclustijden halen tijdstempelgegevens uit bestaande machinesignalen, barcodescanners of logboeken van MES-werkorders om de werkelijke cyclustijd bij elk station te berekenen en deze te vergelijken met de takt-tijd-doelstellingen.
De logica is direct. Elk station waar de werkelijke cyclustijd consistent boven de takt-tijd ligt, is een knelpunt in de productie. Het probleem is dat de meeste fabrieken die vergelijking niet op stationniveau hebben, uitgesplitst over drie diensten, met voldoende gegevens om een structurele beperking te onderscheiden van dagelijkse variatie.
Deze platforms voor workflowmonitoring vereisen geen nieuwe hardware. Ze maken gebruik van tijdstempels van bronnen die al op de werkvloer actief zijn:
- Logboeken van barcodescanners bij elk station (tijdstempels voor scan-in en scan-out)
- PLC-cyclustellersignalen via OPC-UA
- Openingstijden en sluitingstijden van MES-werkorders
- Handmatige invoer door operators via tablet voor stations zonder geautomatiseerde signalen
De output is een overzicht van de takt-tijdnaleving voor elk station, per ploeg. Een station dat tijdens de dagdienst op 95% naleving draait en tijdens de nachtdienst op 71%, heeft geen nieuwe apparatuur nodig. Er is een gericht onderzoek naar procesmonitoring nodig voor die specifieke ploeg en dat station.
Vorne XL en Lineview werken volgens dit model, waarbij ze verbinding maken met bestaande signaalbronnen en real-time analyses van cyclustijden presenteren.
De laag voor cyclustijden voedt direct de volgende categorie voor workflowmonitoring: historische patronen die in dagelijkse rapportages nooit naar voren komen.
4. SCADA Historian en operationele data-analyse
SCADA-historianplatforms slaan continu elke overgang in de machinestatus op. Analysetools die verbinding maken met deze bestaande datalaag onthullen terugkerende knelpunten die onzichtbaar blijven in rapportages aan het einde van een ploeg of week.
Fabrieken die SCADA-systemen zoals Ignition, AVEVA of FactoryStudio gebruiken, bouwen historian-databases op met maanden of jaren aan machinestatusgegevens. Het merendeel van die data wordt nooit geanalyseerd voorbij de totale productiecijfers aan het einde van een ploeg. De workflowmonitoring en procesmonitoring waarde die daarin besloten ligt, is aanzienlijk.
Historian-analyses brengen patronen aan het licht die in dagelijkse rapportages volledig worden gemist:
- Clustering op tijdstip: een machine die drie weken achter elkaar herhaaldelijk stopt tussen 02:00 en 03:00 uur, heeft een voorspelbaar onderhoudsprobleem en geen willekeurige storingsmodus.
- Cascade-reeksen: stroomopwaarts station B stopt consequent 12 minuten voordat stroomafwaarts station D zonder materiaal komt te zitten, over 30 ploegendiensten heen. Dat is een beperking in de materiaalstroom, geen toeval.
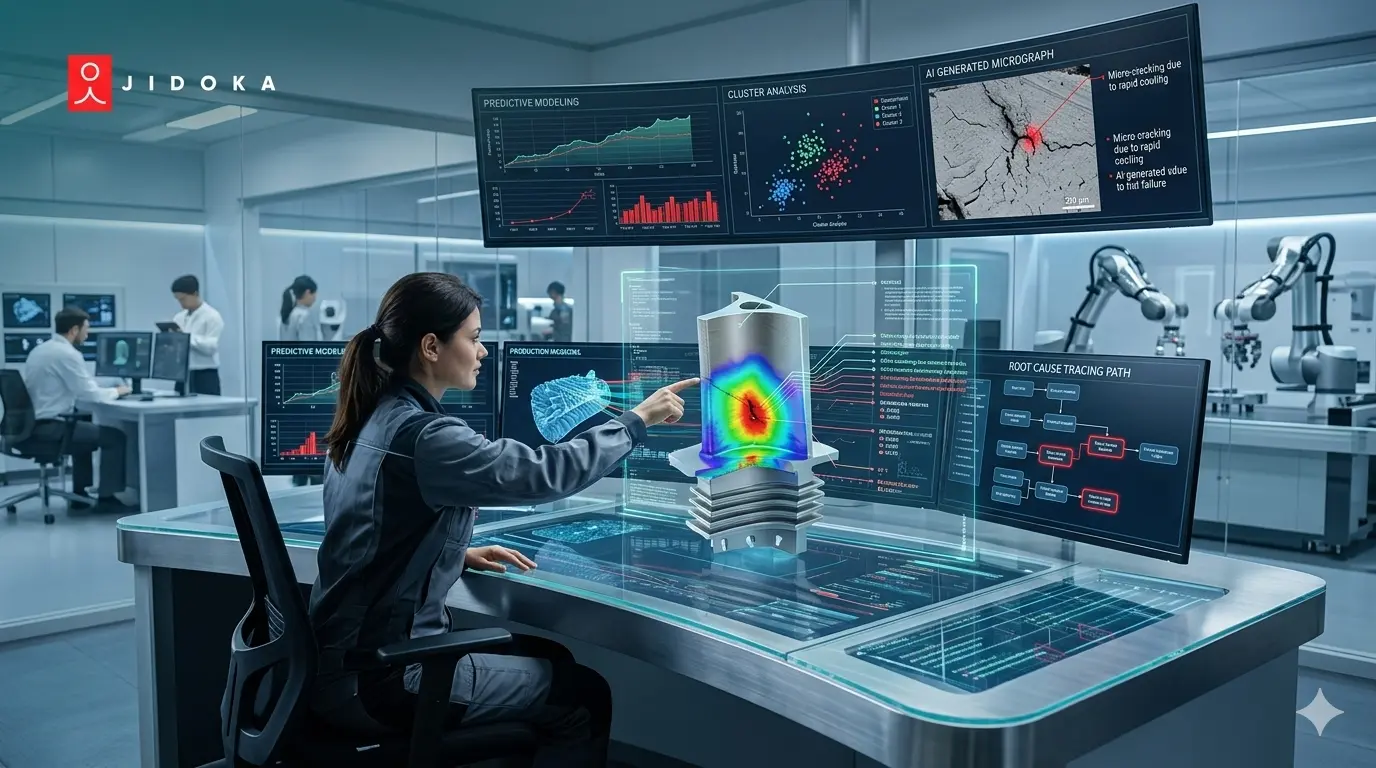
- Voorspellende indicatoren: trillingsmetingen of temperatuurwaarden van bestaande sensoren die zes uur voor een stilstand boven de basislijn uitkomen, creëren interventiemomenten die reactief onderhoud niet kan bieden.
AVEVA System Platform Analytics en Cognite Data Fusion maken verbinding met bestaande historian-lagen zonder nieuwe hardware en brengen deze patronen in kaart via configureerbare dashboards.
Het verschil met Tool 1: OEE-workflowmonitoring toont je de knelpunten in de productie in real-time. Historische analyses laten het patroon erachter zien, over weken en ploegendiensten heen. Dat is precies wat een Kaizen-team nodig heeft om een structurele oplossing te ontwerpen in plaats van een tijdelijke pleister voor de huidige ploeg.
5. MES-workflowanalyses en monitoring van de onderhanden werk-wachtrij (WIP)
MES-workflowanalysemodules analyseren de wachtrijlengte van onderhanden werk (WIP), de doorlooptijd tussen stations en de voltooiingspercentages van routes om te bevestigen waar WIP zich ophoopt en welke stations structureel te laat aanleveren.
OEE meet machineprestaties. MES-workflowmonitoring meet processtromen. Een machine die op 95% OEE draait, kan nog steeds een systemisch knelpunt in de productie zijn als het het enige aanleverpunt is voor vijf daaropvolgende stations. OEE laat dat niet zien. De wachtrijlengte van het onderhanden werk wel.
Belangrijke statistieken beschikbaar uit bestaande MES-data:
- Wachtrijlengte per station: elk station waar de gemiddelde wachtrijlengte meer dan twee keer de cyclustijd bedraagt, vormt een structureel knelpunt.
- Doorlooptijd tussen stations: de tijd tussen de voltooiing van een werkorder op het ene station en de start op het volgende. Gaten die groter zijn dan 15% van de cyclustijd wijzen op vertragingen in het materiaaltransport of beperkingen in de beschikbaarheid van operators, niet op machineproblemen.
- Leeftijdsverdeling van werkorders: werkorders die meer dan twee cycli in een wachtrij staan voordat ze worden opgepakt, duiden op een onbalans in de planning bij het voorgaande station.
De meeste fabrikanten werken al met Siemens Opcenter, SAP DMC, MPDV HYDRA of Plex. De analytische laag voor workflowmonitoring is geen nieuwe aankoop. Het is een kwestie van configuratie van bestaande licenties.
De combinatie die de primaire beperking bevestigt
Combineer MES-wachtrijdata met OEE-microstoppagedata uit Tool 1. Een station met veel microstoppages en een lange wachtrij ervoor is de primaire beperking. Een station met een lage OEE maar zonder wachtrijopbouw is secundair. Los eerst het eerste probleem op. Dit tweelaagse overzicht van workflowmonitoring is waar data verandert van beschrijvende rapportage naar bruikbare technische beslissingen.
Hoe Jidoka Technologies in deze stack past
NAGARE van Jidoka Technologies levert twee van de vijf tools in één implementatie: AI-procesmonitoring met behulp van bestaande camera's en afwijkingsdata per stap die direct bijdraagt aan analyses van cyclustijden en takt-tijden.
Belangrijke mogelijkheden voor fabrieken die een combinatie van bovenstaande workflow-monitoringtools gebruiken:
- Maakt verbinding met bestaande IP-camera's via RTSP. Geen nieuwe vision-hardware nodig.
- Volgt 100% van de montagestappen via dual-stream AI (objectdetectie + actieherkenning) op edge-units.
- Genereert gegevens over afwijkingsfrequenties per stap, ploeg en station. De CI-input die handmatige observatie vervangt en Kaizen-events voedt met objectief bewijs over meerdere ploegen heen.
- Vermindert rework met 20 tot 35% en neemt een belangrijke oorzaak van WIP-wachtrijen bij downstream-stations weg.
Plan een technische walkthrough van 30 minuten met het team van Jidoka om te zien hoe NAGARE aansluit op uw huidige infrastructuur op de werkvloer en welke camera's vandaag al ingezet kunnen worden.
Conclusie
De vijf bovenstaande workflow-monitoringtools hebben één ding gemeen: ze gebruiken data die uw werkvloer al genereert. OEE van bestaande PLC's, procesafwijkingen van aanwezige camera's, cyclustijden uit scanlogs, foutpatronen uit historiandata en WIP-opbouw uit MES-records. De knelpunten in de productie die zij blootleggen zijn niet nieuw. Ze zenden al maanden, soms jaren, signalen uit.
De vraag is of uw stack voor workflow-monitoring die signalen ook daadwerkelijk leest. Begin met NAGARE om te zien wat uw huidige camera's al vastleggen.
Plan een afspraak met het team van Jidoka.
Veelgestelde vragen
1. Wat zijn workflow-monitoringtools in de productie?
Workflow-monitoringtools zijn softwareplatforms die processtromen, machineprestaties en de naleving door operators op productielijnen in realtime volgen. Ze maken verbinding met bestaande PLC's, camera's, MES-systemen of SCADA-historians om knelpunten in de productie, afwijkingen in cyclustijden en hiaten in procesmonitoring aan het licht te brengen, zonder dat er nieuwe hardware geïnstalleerd hoeft te worden of de productie moet worden stilgelegd.
2. Hoe verminderen workflow-monitoringtools knelpunten in de productie?
Ze brengen data aan het licht die bij handmatige methoden over het hoofd worden gezien: micro-stops die te kort zijn voor alarmlogs, variaties in cyclustijden tussen ploegen, afwijkingen in montagestappen die leiden tot rework-wachtrijen en patronen in WIP-accumulatie. Elk daarvan is een bevestigd signaal voor een knelpunt in de productie. Workflow-monitoring biedt de zichtbaarheidslaag die elk knelpunt aanpakbaar maakt, in plaats van dat ze onzichtbaar blijven in de dagelijkse ploegtotalen.
3. Kan OEE-monitoringsoftware werken zonder nieuwe hardware?
Ja. Moderne OEE-workflow-monitoringplatforms maken verbinding met bestaande PLC's via OPC-UA of een Ethernet-tap. Waar PLC's geen OPC-UA ondersteunen, kunnen goedkope stroomsensorklemmen op bestaande voedingslijnen worden bevestigd om dezelfde signalen door te geven. De meeste fabrieken met Siemens, Allen-Bradley, of Mitsubishi PLC's kunnen binnen één werkdag worden gekoppeld aan een procesmonitoringsplatform.
4. Wat is het verschil tussen OEE-monitoring en procesconformiteitsmonitoring?
OEE-workflowmonitoring meet de machineprestaties: beschikbaarheid, snelheid en kwaliteitspercentage. Procesmonitoring voor conformiteit meet of operators elke montagestap correct en in de juiste volgorde uitvoeren, bij elke cyclus. Beide zijn tools voor workflowmonitoring, maar ze brengen verschillende soorten knelpunten aan het licht. OEE identificeert knelpunten in de machinesnelheid. Procesmonitoring identificeert afwijkingen in de stappen die leiden tot herstelwerkzaamheden en stilstand verderop in het proces.
5. Hoe maakt AI-procesmonitoring gebruik van bestaande camera's?
AI-software voor procesmonitoring maakt verbinding met IP-camera's via RTSP, hetzelfde protocol dat wordt gebruikt voor beveiligings- en bewakingsbeelden. De AI voert objectdetectie en actieherkenning uit op de live stream en vergelijkt elk frame met een digitale SOP. Er zijn geen nieuwe camera's nodig. Jidoka's NAGARE wordt binnen 3 tot 5 dagen op één station geïmplementeerd met behulp van camera's die al boven de werkplek zijn geplaatst.