












PRODUCTIVITY & LINE ANALYTICS

Production Monitoring AI to Find Lost Time on Your Line

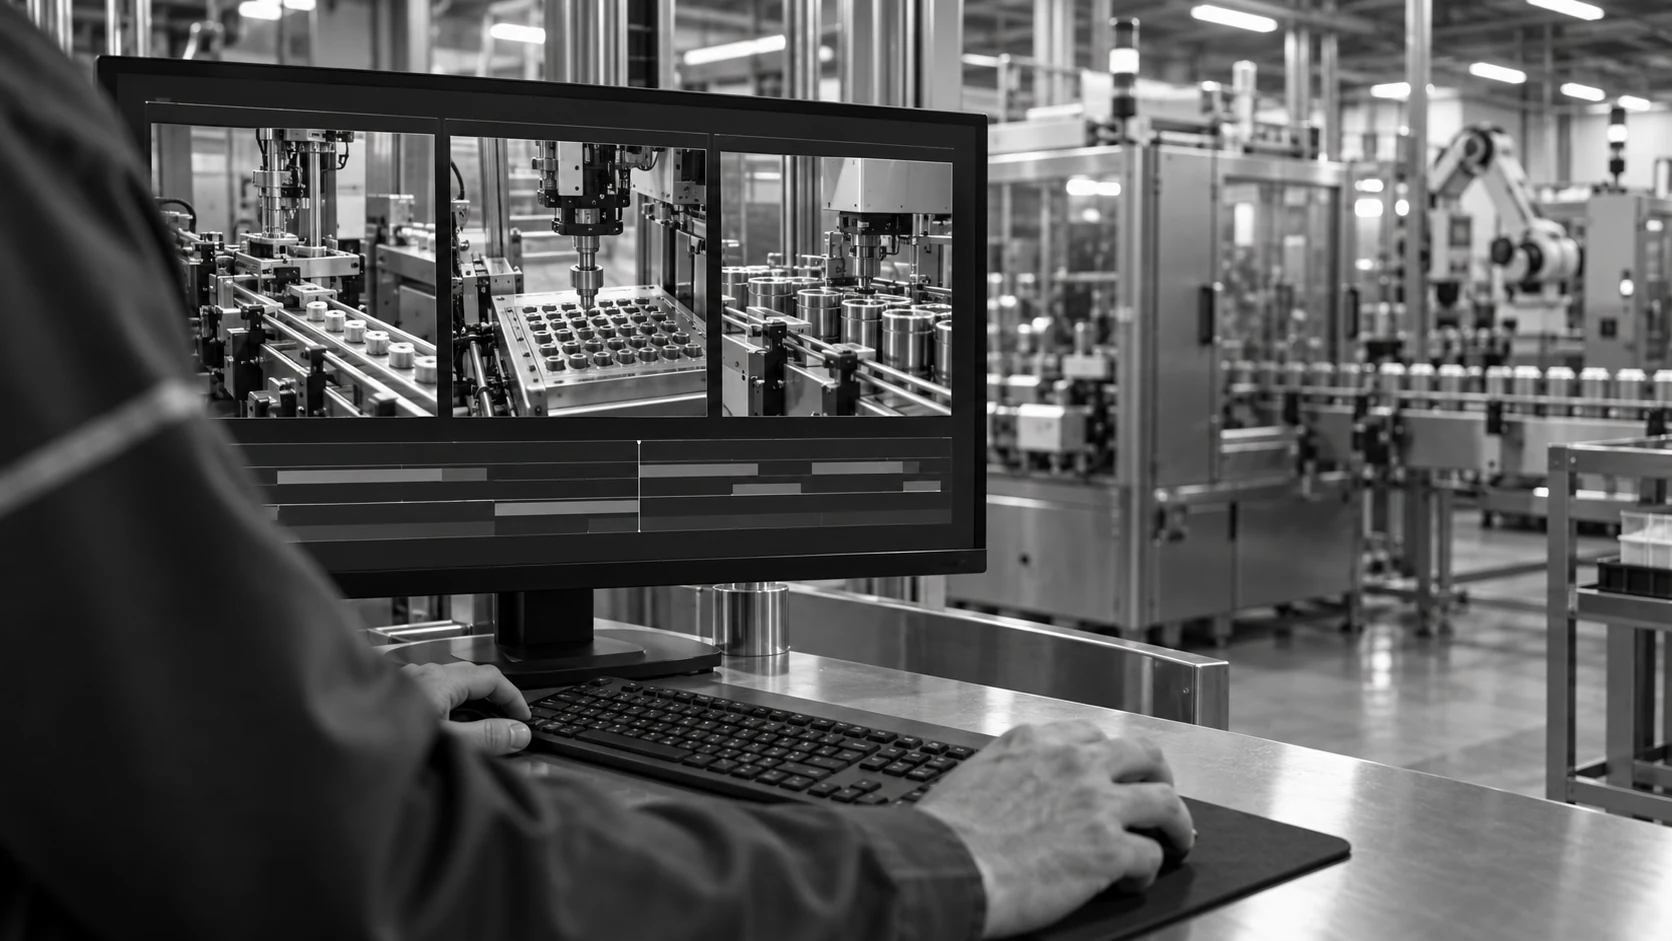
NAGARE AI brings production monitoring to the cameras already on your line. Measure cycle times, reveal brief stoppages and compare actual work with your standards, so teams can address lost time while the shift is still running.

Get in touch

Trusted by manufacturers to improve quality on the line

THE PROBLEM

Your Shift Report Shows the Shortfall. The Lost Seconds Stay Hidden.

Production monitoring should explain where time goes between the start and finish of a job. A slow handoff, repeated adjustment or short wait can disappear inside the shift average. By the time a supervisor investigates, the line has moved on and the evidence is gone.

An Average Hides the Difficult Cycles

A sampled time study can miss the repeated adjustment, material wait or awkward handoff that occurs outside the observation window.

Brief Stops Never Reach the Log

Seconds lost between operations are easy to overlook. Repeated across a shift, those small interruptions become a meaningful production loss.

Teams Compare Different Versions of the Job

A change in product, method or station setup can make yesterday's target misleading. Without context, a slower cycle is hard to explain or improve.
The Solution

See the Work Behind Your Production Numbers

NAGARE turns visible actions and station activity into a record of how work actually runs. Measure the cycle, compare it with the agreed standard and review the footage behind a delay, so improvement starts with a specific operation.

Measure the Cycle Where the Work Happens

  • Define visible start and finish events for each monitored operation
  • Measure repeat cycles across the agreed stations and camera views
  • Compare observed work with the standard for that product and method
  • Review variation without depending on occasional stopwatch samples
Cycle by cycle
actual duration recorded
Against the standard
differences made visible
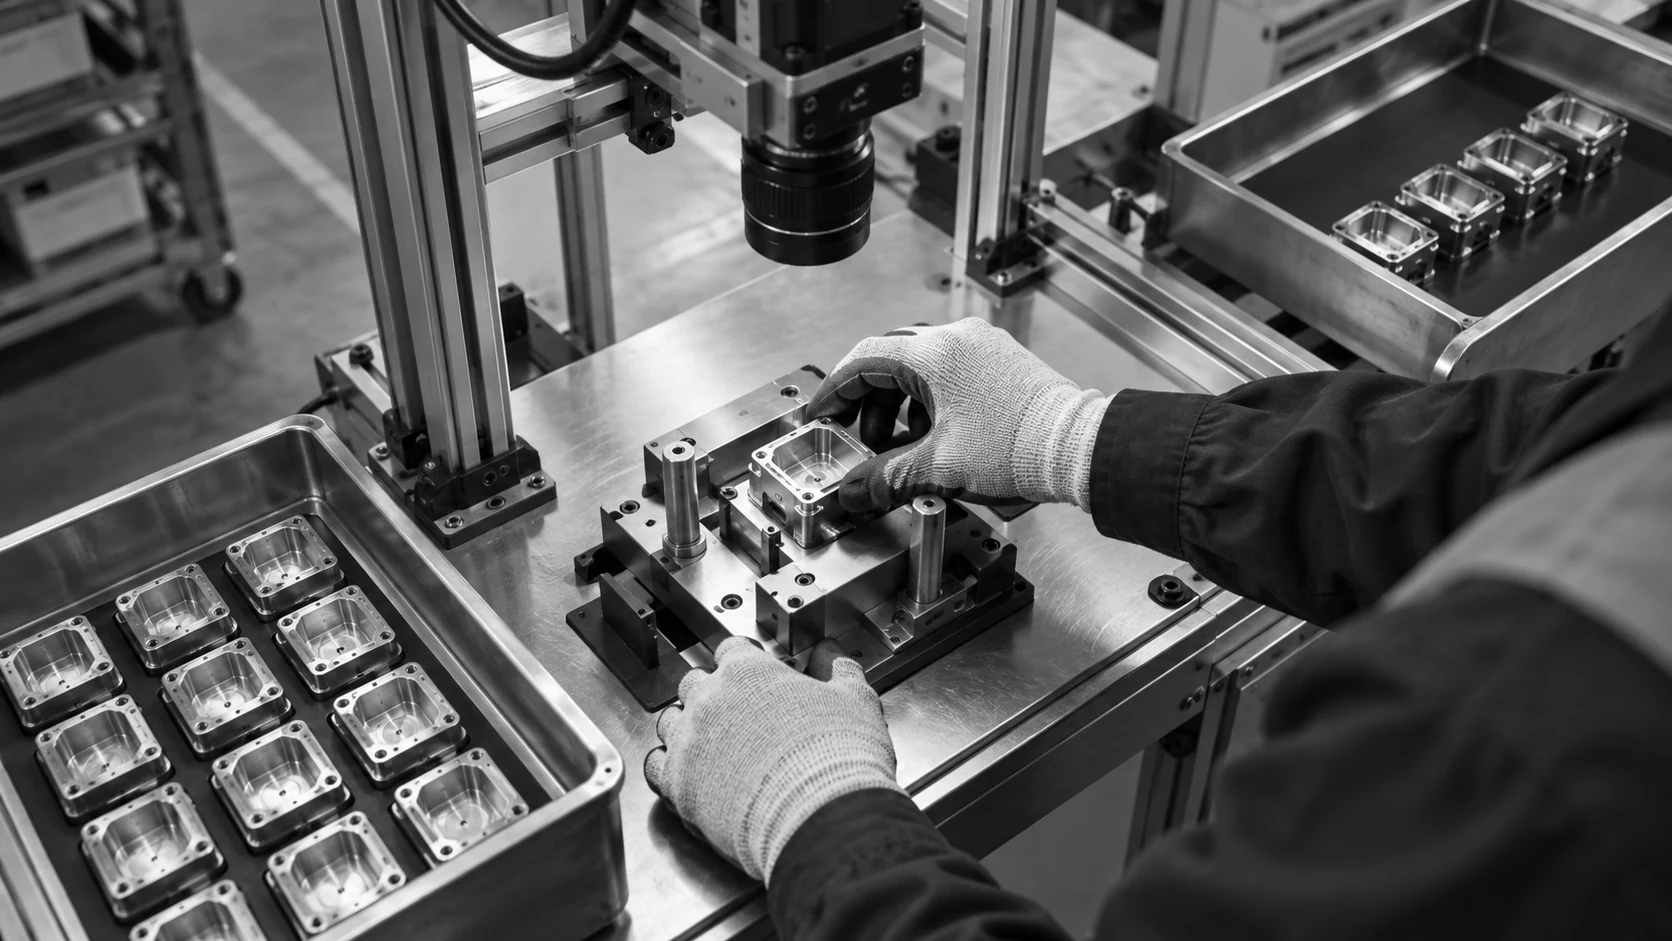
Find the Small Interruptions That Add Up

  • Identify visible idle periods and brief stops in the monitored workflow
  • Apply agreed timing thresholds to separate normal pauses from exceptions
  • Locate the operation and footage associated with a recurring delay
  • Give supervisors evidence to investigate the cause and agree a response
Short stops
included in the review
Video context
behind the lost time

Turn Shift Data Into a Specific Improvement

  • Bring cycle durations and observed idle periods into a shared dashboard
  • Compare like-for-like work by station, shift and configured product context
  • Use time-and-motion evidence to review methods and update standards
  • Check whether a process change reduces the delays it was meant to fix
Shared definitions
for comparable performance
Before and after
improvements checked
DEPLOYMENT

Live On Your Line, With Measurements You Can Trust

Start with the stations and losses that matter most. We check camera coverage, define what each event means and validate the timing against your process before the team relies on the dashboard.

STEP 01

Map the work and camera views

Choose the stations, define cycle boundaries and check that the cameras can see the actions and handoffs you need to measure.

STEP 02

Train on your process

Use representative footage from your line. Agree the activity labels, timing thresholds, standards and product context with your production team.

STEP 03

Go live, with timing verified

Compare measured events with reviewed footage, confirm the dashboard definitions and establish how supervisors will investigate exceptions.

Connect with us

Bring your cycle targets and recurring delays. We will scope the measurements on your line.

Get In Touch
20%Reduction in process time
30%Reduction in downtime
4 weeksNAGARE deployment timeline
120 minutesTraining footage baseline

Platform benchmarks; outcomes depend on the application, baseline and deployment scope.

What Changes When You Can See Where Time Went

Manual studies, machine signals and video each reveal a different part of the process. Add visual evidence where the numbers need context, then use the same definitions to compare performance across shifts.

Dimension
Manual studies and logs
Machine signals and counters
Jidoka · NAGARE
What is measured
Selected cycles and recorded stops
Events available from connected equipment
Configured visible actions, cycles and idle periods
Manual work
Depends on observation coverage
Visible only if instrumented or logged
Measured where the camera can see the defined event
Brief interruptions
Can be missed between observations
Captured where the signal and logging resolution support it
Flagged against agreed visible-event thresholds
Standard comparison
Prepared from recorded samples
Based on the available signals and targets
Observed duration compared with the agreed work standard
Evidence for review
Notes, timing sheets or recorded studies
Event history and equipment data
Time measurements with supporting video context
Improvement review
Repeat the study after a change
Compare available equipment metrics
Compare matched periods, operations and product context

Frequently Asked Questions

Production monitoring tracks how work progresses on a factory floor so teams can identify losses and compare actual performance with expectations. For this NAGARE application, the focus is visible work: cycle durations, idle periods and differences from agreed standards. Camera evidence helps a supervisor investigate an exception instead of relying only on a count or an end-of-shift explanation.

For a defined operation, cycle time measurement subtracts the recorded start timestamp from the finish timestamp. Keep those event boundaries consistent across repeated cycles. Cycle time analysis then examines the distribution, recurring delays and differences between comparable runs. A machine cycle, operator work sequence and complete line cycle are different measurements, so agree which one the dashboard represents.

Common tools include a stopwatch, observation sheet, process recording and time study software. A time and motion study combines duration with an examination of how the work is performed. NAGARE uses visible actions and station events to support that measurement. Engineers still define the method, validate the observations and decide which changes are practical for the production environment.

A video time study can provide evidence of an operation when the relevant actions and cycle boundaries are visible. Camera angle, lighting, frame rate and obstructions affect what can be measured reliably. During scoping, review representative footage from the actual station, including normal variation. Existing cameras are assessed for suitability before coverage and timing expectations are agreed.

No. Idle time monitoring shows when defined activity is absent; it does not establish the cause by itself. An operator may be waiting for material, a machine or a downstream handoff. Review the surrounding footage and production context before deciding on corrective action. The useful question is what prevented work from continuing and whether that interruption can be removed.

Micro-stoppage detection flags visible interruptions that meet an agreed duration and event definition. The shortest reliable interval depends on camera coverage, image quality, frame rate and the activity being measured. Validate the threshold on representative examples, including normal pauses and genuine interruptions. This avoids treating every brief movement change as lost production or overlooking recurring stops.

Standard time comparison needs a current reference for the same operation, product and working method. Compare equivalent cycle boundaries and account for agreed allowances, planned pauses and abnormal events. NAGARE supplies observed timing evidence; your engineering team owns the standard. Review any mismatch before changing a target, especially after tooling, material presentation or product variants change.

No. Production line monitoring through cameras adds evidence about visible work and delays. An MES also manages activities such as orders and execution records, while complete OEE requires agreed availability, performance and quality inputs. Define the data exchange during deployment. Camera observations can complement existing systems, but the page's scoped applications do not imply a complete MES replacement.

Useful shop floor analytics shows the agreed cycle durations, idle periods and deviations with station, shift and product context. A supervisor should be able to move from a recurring exception to the relevant evidence. Keep metric definitions consistent and show the observation period, so teams do not compare a short sample with a full shift or unlike operations.

Use production analytics to compare equivalent periods before and after the change, holding the product and operation definitions consistent. Review cycle variation and recurring interruptions alongside output and quality measures from the relevant systems. A faster observed operation is useful only if the improvement persists and does not move the delay elsewhere or introduce a new quality problem. Keep the original baseline and review the same observation window on each shift after the change.

NAGARE supports on-premises edge processing for manufacturing video analytics. Deployment starts with camera suitability, representative training footage and agreed event definitions. Configure access, retention and integration requirements with the team responsible for the site. The platform baseline is 120 minutes of training footage and a four-week deployment timeline; the final scope depends on the stations and operating conditions.

CONNECT WITH OUR EXPERTS

CONNECT WITH OUR EXPERTS

Bring your cycle targets and the delays your reports cannot explain. We will map how NAGARE can measure the work on your line.

Get in touch