











CYCLE-TIME MEASUREMENT

Cycle Time Measurement to Find Where Every Second Goes

NAGARE automates cycle time measurement at manual stations, timing every cycle from video instead of a short stopwatch sample. Each start and finish is detected the same way on every shift, so averages, spread and the slowest cycles are visible for each station and operation.

Book a Line Review

Trusted by manufacturers for error-free manual operations

THE PROBLEM

A Stopwatch Sees a Few Cycles on a Good Day

Manual cycle times vary with the operator, the variant and the hour. A study of twenty cycles captures one moment, and the line is then balanced on numbers that no longer match reality.

Observers Change the Work

People work differently when someone with a clipboard is watching, so the measured cycle is rarely the normal one.

Variation Gets Averaged Away

A single average hides the long cycles that starve the next station and the short ones that skip work.

Studies Go Stale

Methods, staff and products change after the study, and the numbers on the balance chart quietly drift out of date.
The Solution

Time Every Cycle the Same Way, Every Shift

Our AI process monitoring software, NAGARE™, performs cycle time measurement continuously by detecting when each cycle and operation starts and ends on camera. Results are timed consistently across operators and shifts, with no one standing at the station. The productivity figure is a NAGARE product-level metric. Confirm any effect on your measured station during the trial.

Detect Start and Finish Automatically

  • Recognise the action that begins and ends each cycle
  • Time individual operations within the cycle
  • Apply the same rules to every operator and shift
  • Run from existing cameras where the view allows
Every cycle
Timed, not sampled
Per operation
Breakdown within the cycle
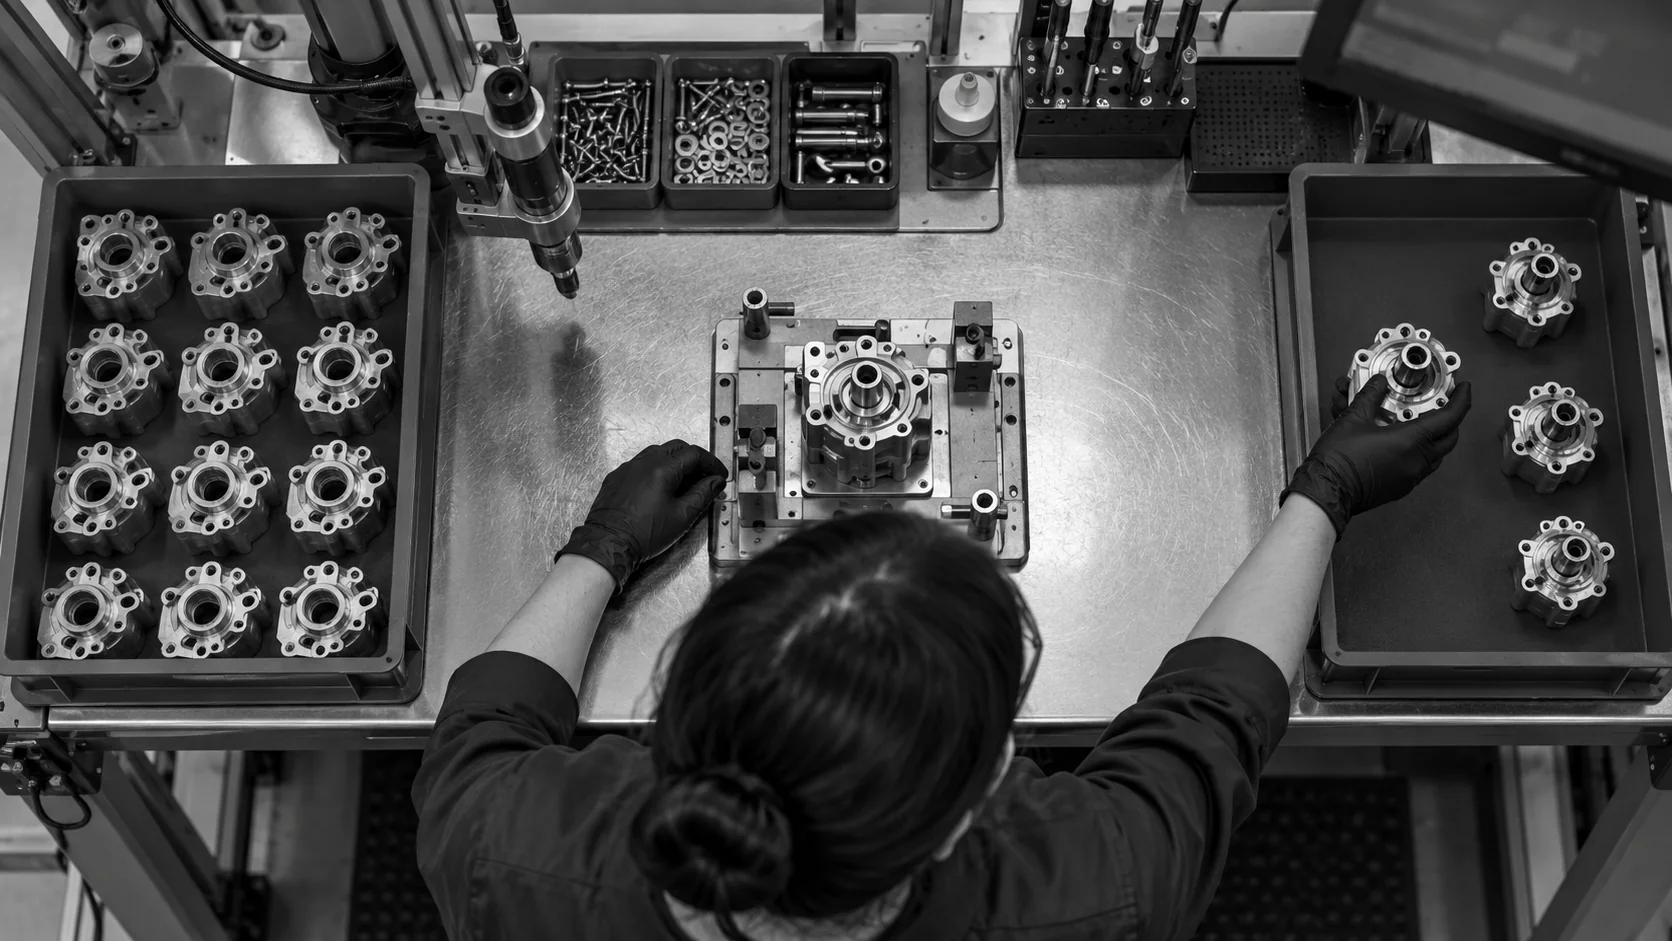
Conceptual illustration of a completed unit leaving an assembly nest within a fixed camera view.

See Spread, Not Just Averages

  • Review median, spread and the slowest cycles for the configured station
  • Compare variants, shifts and operator groups fairly
  • Find the station that limits line output
  • Link long cycles to their video clips
20%
Productivity impact
Clip-linked
Long cycles reviewable
HOW IT WORKS

How Cycles Are Timed From Video

Cycle time measurement with NAGARE relies on a consistent definition of where each cycle begins and ends, applied by a model to every cycle the camera sees.

Highlight #1

Define Start and End

Engineering agrees which action begins and ends a cycle and each operation, using recorded cycles from the station.

Highlight #2

Time Every Cycle

The model detects those actions on every cycle and records the time for the cycle and its operations.

Highlight #3

Analyse Spread and Bottlenecks

Results show median, spread and slow cycles by station, variant and shift, with clips for the outliers.

Connect With Us

Send a video of one station and your current cycle figures. We will show how measured cycles compare with the study.

Get In Touch

Ways to Measure Manual Cycles

Each method produces a number. They differ in how many cycles it covers, how consistent it is and whether you can see why a cycle ran long.

Measurement need
Stopwatch study
Machine and MES data
NAGARE AI
Cycles covered
A short sample
Machine cycles only
Every manual cycle
Consistency
Varies by observer
Fixed signals
Same rule on every cycle
Why a cycle ran long
Observer notes
Not visible
Clip of the cycle
Timing evidence
Balance based on a sample
Manual work estimated
Balance based on measured reality
CUSTOMER SUCCESS

APA Engineering Tracks Cycle Time per Step and per Kit

At APA Engineering, NAGARE monitors cycle time for every step and every kit across its kitting stations, alongside real-time sequence and quantity verification.

Official Jidoka case-study cover for APA Engineering kitting process monitoring
APA Engineering Tracks Cycle Time per Step and per Kit
Engineering

APA Engineering's published results cover its complete export kitting operation, of which cycle monitoring is one part.

  • Cycle time monitored per step and per kit, with productivity tracked across stations
  • 35% increase in productivity with ROI in under one year

Frequently Asked Questions

How does cycle time differ from takt time?

Cycle time is how long a station or operator actually takes to complete one unit. Takt is the pace required to meet customer demand, set by available working time divided by demand. A station whose cycle exceeds the required pace becomes a constraint on the whole line. Comparing the two, station by station, is the starting point for balancing work and deciding where improvement effort should go first.

Why is a stopwatch study not enough?

A manual timing study captures a limited number of cycles, often with the operator aware of being watched. It is useful for setting up a method, but it misses rare long cycles, changes across shifts and drift after the study. Continuous cycle time measurement covers every cycle, so the figures reflect normal work rather than a few observed minutes. Studies remain valuable when designing a new method.

Where should a cycle start and end?

The start and end points must be the same every time, or results become noise. A common choice is to time from the start of one action to the start of the same action on the next unit, because operators often reorder the steps in between. Each work element inside the cycle can be timed in the same way, so long cycles can be traced to the element that caused them.

Why look at spread and not just the average?

Two stations with the same average can behave very differently. One may be steady while the other alternates between quick cycles and long stalls that starve the next station. Cycle-to-cycle variation, the median cycle and the standard deviation together show which stations are predictable and which need attention, and they make an improvement easier to prove afterwards.

How does this help with line balancing?

Balancing the line needs a consistent definition of the work and comparable product mixes. Measured cycles can highlight a candidate bottleneck station, but confirm it against waiting, buffers, machine availability and the surrounding line before moving tasks. Compare repeated cycles and relevant shifts, then review whether the change improves output without moving the constraint elsewhere. Video and balance charts support that investigation. A long average alone does not prove which station limits the whole line.

Can it combine manual cycles with machine data?

Machines may report cycles through their control system while manual stations report little. Camera-derived observations can help close that gap. Combining them with MES timestamps requires agreed interfaces, synchronized clocks, unit or batch context and comparable station cycle time definitions. Confirm which connections and views are available in the proposed deployment rather than assuming machine data joins automatically. A shared timeline is useful only when the event meanings and any missing observations are understood by the team.

What does cycle time analysis reveal beyond the numbers?

Linking each long cycle to its video clip shows the reason behind it: a missing part, a difficult fit, a tool out of reach or a method that differs between operators. That turns a timing report into a list of improvement ideas. Supervisors review a handful of clips instead of standing at the station, and engineers can test a fix and see its effect quickly. Over a few weeks, the clips also show which causes are rare and which repeat on every shift.

What should we send to start cycle time measurement?

Send a video of the station across a normal shift, the current takt and any existing study figures, and the variants built there. Tell us which stations you think limit output. With that, we can agree the cycle start and end definition, propose camera positions and show the first measured results for review.

CONNECT WITH OUR EXPERTS

Show Us the Station You Think Limits Output

Share a station video, your takt and the current study figures. We will plan cycle time measurement for that line and explain timing and cost. Most measurement projects are producing data within 4 weeks.

Book a Line Review
Close video