.webp)
El proyecto Six Sigma se cierra. El certificado va a la pared. Noventa días después, la tasa de desperdicio está tres puntos por encima de la del cierre y nadie sabe explicar por qué.
Esto no es un fallo de la optimización de procesos Six Sigma. Es un fallo de supervisión. El marco DMAIC identifica la variación, la mide con precisión e instala una solución. Lo que no hace, por diseño, es vigilar el proceso una vez implantada esa solución. Esa responsabilidad recae en la fase de Control, y la mayoría de las plantas no le han dado la infraestructura que necesita.
La optimización de procesos Six Sigma usa DMAIC para reducir defectos y variación. La IA acelera las fases de Medición, Análisis y Control al sustituir auditorías periódicas por datos de ciclo en tiempo real. La supervisión de procesos basada en visión cierra el bucle DMAIC detectando las desviaciones en el momento en que se producen, antes de que se acumule el coste de retrabajo.
La IA no sustituye a la optimización de procesos Six Sigma. Le da a la fase de Control lo que siempre le ha faltado: un mecanismo que funciona a velocidad de producción, no a frecuencia de auditoría.
Esta guía desglosa cómo se aplica la IA a cada fase DMAIC, por qué la fase de Control es el hueco estructural y qué aspecto tiene cerrar ese hueco en una línea real.
Qué mide realmente la optimización de procesos Six Sigma
La optimización de procesos Six Sigma ataca la variación del proceso, no los defectos directamente. Los defectos son la salida de una variación no controlada. Controle la variación y las tasas de defecto caen como resultado matemático predecible.
La mayoría de los profesionales conocen el control de calidad Six Sigma como un método de mejora en cinco fases. Lo que importa a nivel operativo es que DMAIC es secuencial por diseño: cada fase condiciona la siguiente. Eso es una fortaleza durante un proyecto activo y una vulnerabilidad estructural en cuanto el proyecto se cierra.
La fase de Control hereda la infraestructura de supervisión que existiera antes de arrancar el proyecto. En la mayoría de las plantas eso significa supervisión periódica: una muestra al inicio del turno, una auditoría dos veces por semana, comprobaciones de fin de línea antes de expedir el lote.
Por qué el RTY revela lo que el rendimiento final oculta
El rendimiento acumulado (RTY) es la métrica que hace visible este problema. Multiplica la tasa First-Time-Right de cada paso del proceso, no solo del último. Es la medida central de cualquier iniciativa seria de mejora del proceso productivo.
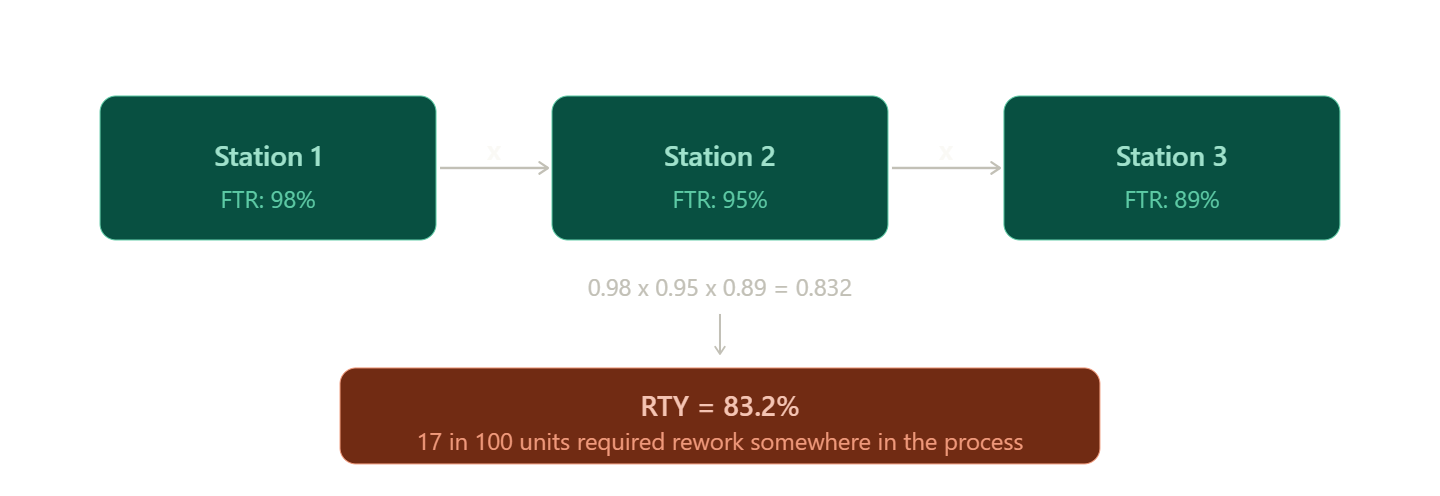
Una línea de tres pasos con tasas del 98 %, 95 % y 89 % produce un RTY del 83,2 %:
RTY = 0,98 × 0,95 × 0,89 = 0,832
Es decir: 17 unidades de cada cien necesitaron retrabajo en algún punto del proceso, aunque el rendimiento final expedido pareciera aceptable. El RTY revela la fábrica oculta. El rendimiento final la disimula.
El detalle técnico decisivo: calcular el RTY exige datos por paso. Una auditoría por turno no puede generarlos. Hace falta medición a frecuencia de ciclo para ver dónde entra la variación en el proceso, exactamente lo que la fase de Medición exige y exactamente lo que la mayoría de las plantas dejan de recoger cuando el proyecto termina.
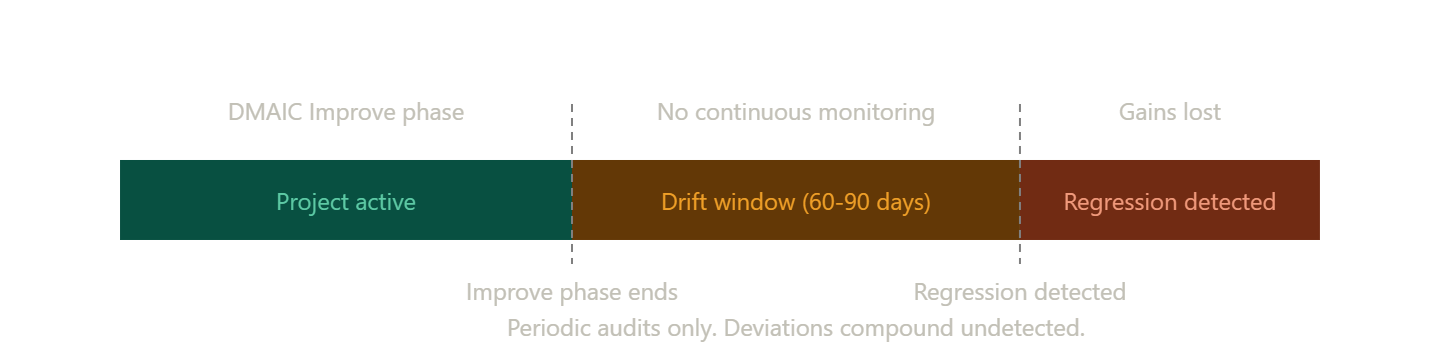
Ese hueco crea la ventana de deriva del DMAIC: el periodo entre la mejora lograda al final de la fase de Mejora y la primera regresión detectada. Sin supervisión continua, esa ventana dura entre 60 y 90 días en la mayoría de las plantas.
Dónde cambia la IA la ecuación en cada fase DMAIC
No todas las fases DMAIC se benefician igual de la IA. Esta es una valoración práctica de dónde cambian de verdad los números y dónde no.
1. Definir y Mejorar: valor limitado de la IA
Definir es una decisión de criterio humano. La IA puede sacar a la luz patrones en agrupaciones de garantías y datos de reclamaciones para afinar el planteamiento del problema, pero qué problema prioriza la organización es una decisión de recursos y de estrategia. La IA reduce las opciones. No decide.
Mejorar sigue la misma lógica. Las simulaciones con gemelo digital permiten probar cambios de proceso sin parar la línea, lo que aporta valor real a cualquier programa de optimización del proceso productivo. Pero el diseño de la mejora sigue exigiendo criterio de ingeniería. La IA comprime el ciclo de prueba. No sustituye el razonamiento detrás del cambio.
2. Medir y Analizar: alto valor de la IA
La fase de Medición es donde la ecuación económica cambia de forma apreciable. Los sistemas de visión artificial capturan a frecuencia de ciclo lo que los ciclos de medición manual no pueden:
- Tiempo de ciclo en cada estación, no muestreado a lo largo de un turno
- Finalización de pasos y cumplimiento de la secuencia en cada unidad
- Presencia, orientación y estado de apriete de cada componente en tiempo real
- Datos de Gauge R&R sin parar la línea para rondas de medición manual
El cálculo del Cpk en tiempo real a velocidad de producción sustituye a la revisión de gráficos SPC por turno. El intervalo entre «el proceso se ha desviado» y «el equipo de calidad se entera» pasa de horas a segundos. Esa compresión es donde la optimización de procesos Six Sigma gana velocidad en la fase de Medición.
En la fase de Análisis, los algoritmos de detección de anomalías identifican qué parámetros del proceso impulsan realmente la variación. El análisis de causa raíz deja de ser un ejercicio retrospectivo y pasa a ser una investigación en vivo. Lo que antes costaba dos turnos rastrear aparece ahora en el ciclo concreto en que ocurrió: un cambio de fondo en cómo se trabaja la fase de Análisis.
3. Controlar: el mayor valor y la fase peor atendida
La fase de Control es la que más se beneficia de la IA y la que menos atención recibe de las herramientas actuales. La mayoría de los productos de visión con IA se posicionan como sistemas de inspección. Detectan defectos al final de la línea. No supervisan el proceso que genera esos defectos.
La optimización del proceso productivo exige cerrar el bucle de realimentación dentro del proceso, no después de él. Inspección y control son funciones distintas. Esa distinción determina si las mejoras se mantienen al cerrar un proyecto o se deshacen en silencio a lo largo de un trimestre.
El problema de la fase de Control que Six Sigma no resuelve sin supervisión continua
Los proyectos de optimización de procesos Six Sigma triunfan en la fase de Mejora y se deshacen en la de Control. La causa es estructural: un problema de frecuencia de supervisión, no de metodología. DMAIC da por hecho que existe supervisión continua. No especifica cómo construirla. La mayoría de las plantas recurren por defecto a lo que ya tenían.
En una planta con controles de calidad por turno, el hueco de control dura de 4 a 8 horas por incidencia. En una planta que solo inspecciona a fin de línea, el hueco es toda la serie de producción. Cada hora de ese hueco es una ventana por la que se escapan las mejoras conseguidas.
Lo que ocurre dentro de esa ventana en una línea de fabricación discreta típica:
- Un utillaje se desplaza 0,2 mm. Se producen cuarenta unidades antes del siguiente control. Las cuarenta van a retrabajo.
- Un operario se salta la verificación de par bajo presión de programa. La siguiente auditoría es dentro de seis horas.
- Un lote de material nuevo se comporta de forma distinta a la muestra certificada. El Cpk no lo refleja hasta el informe semanal.
Los gráficos de control estadístico de procesos (SPC) detectan que un proceso se ha salido de los límites de control. No impiden que la siguiente unidad no conforme entre en la línea. El gráfico avisa a posteriori. Ese es el problema de fondo en el diseño de la fase de Control: el SPC es un sistema de detección, no de imposición.
El argumento estructural es claro: hace falta un mecanismo de imposición continua que opere a velocidad de producción, no a frecuencia de auditoría. La cuestión es qué aspecto tiene ese mecanismo en una línea real.
Cómo la supervisión por visión cierra el bucle DMAIC en la práctica
Un sistema de visión capaz de cerrar el bucle debe cumplir cuatro requisitos técnicos concretos:
- Verificar cada paso de montaje o de proceso frente a un SOP digital en tiempo real, en cada unidad.
- Detectar la desviación antes de que la unidad no conforme pase a la siguiente estación.
- Avisar al operario con suficiente detalle para corregir el problema, no solo señalar que existe.
- Registrar datos de ciclo para calcular el RTY y el Cpk de forma continua, de modo que la optimización sea permanente y no solo dure el proyecto.
El requisito de la IA en el borde
Los sistemas de visión en la nube incumplen el requisito de la fase de Control por una razón técnica: la latencia. Un viaje de ida y vuelta a la nube de 3 a 8 segundos es demasiado lento para detener una desviación antes de que avance. Ese retardo es funcionalmente idéntico a un ciclo de auditoría lento: le dice lo que pasó, no impide lo que va a pasar.
La IA en el borde procesa los datos localmente, en la estación, sin viaje de red. Respuesta por debajo del segundo. En líneas que operan a 12.000 piezas por minuto o más, esa diferencia de latencia no es una preferencia de rendimiento: es un requisito binario.
NAGARE en la práctica
NAGARE, la plataforma de supervisión de procesos de Jidoka Technologies, convierte la infraestructura CCTV existente en verificadores de proceso en tiempo real. La mayoría de las líneas no necesitan cámaras nuevas. El sistema está diseñado precisamente para las exigencias de la fase de Control:
- Sigue el 100 % de los pasos de montaje con las cámaras ya instaladas, no una muestra.
- Señala piezas ausentes, secuencias erróneas y orientaciones incorrectas en tiempo real.
- Emite avisos correctivos al operario antes de que la unidad avance.
- Devuelve datos de ciclo al bucle de optimización para seguir el RTY y el Cpk en vivo.
Las plantas que usan NAGARE reportan entre un 20 % y un 35 % menos de retrabajo y un 30 % más de cumplimiento de proceso. Tres fases DMAIC operan a la vez en lugar de en secuencia: NAGARE genera datos de Medición de forma continua, saca a la luz anomalías de Análisis en tiempo real e impone el Control en cada ciclo.
KOMPASS, la capa de inspección de Jidoka, añade un segundo nivel. Alcanza un 99,8 % de precisión o más en líneas reales, revisa cada fotograma en menos de 10 ms y resuelve metales reflectantes, superficies impresas y piezas texturizadas: las geometrías donde las implantaciones periódicas de IA suelen perder precisión.
Cómo elegir herramientas de IA para Six Sigma: un marco de cuatro factores
La mayoría de las herramientas se optimizan para la cobertura. El factor que más determina si la fase de Control se sostiene es la latencia, y la mayoría de las conversaciones de compra lo pasan por alto.
La matriz siguiente cruza cuatro factores con los distintos enfoques de supervisión:
Los cuatro factores de evaluación al elegir herramientas de IA para Six Sigma:
- Cobertura: porcentaje del proceso realmente supervisado, no muestreado.
- Latencia: tiempo entre la desviación y el aviso (la cifra que determina si la fase de Control se sostiene).
- Profundidad de integración: ¿alimenta la salida al MES, al sistema de calidad y al de SOP, o genera un informe que nadie lee?
- Trazabilidad: ¿se puede reconstruir el historial completo de proceso de cada unidad para el análisis de causa raíz y para auditoría?
Conclusión
La deriva del proceso tras un proyecto Six Sigma no es un fallo de DMAIC. La fase de Mejora funcionó. La de Control se quedó con las auditorías periódicas por defecto, y las mejoras se fueron escapando a lo largo de 90 días. Es un fallo de infraestructura de supervisión, y tiene solución.
La supervisión de procesos basada en visión convierte la fase de Control de una función de revisión en un sistema de imposición continua. Ese es el cambio de infraestructura que hace que las mejoras se mantengan después de cerrar el proyecto, y no solo hasta la siguiente auditoría trimestral.
Si sus proyectos DMAIC se sostienen a corto plazo y retroceden con el tiempo, el hueco está casi con seguridad en la fase de Control. La plataforma NAGARE de Jidoka cierra ese hueco sin hardware nuevo. Veamos cómo encaja en su línea.
Preguntas frecuentes
1. ¿Qué diferencia hay entre la optimización de procesos Six Sigma y el lean manufacturing?
Six Sigma ataca la variación y la tasa de defectos con métodos estadísticos para reducir la probabilidad de una unidad no conforme. El lean manufacturing ataca el desperdicio: el tiempo y los movimientos que no añaden valor. Son complementarios. El lean despeja el proceso; Six Sigma estabiliza el resultado. La mayoría de las plantas aplican ambos como Lean Six Sigma, utilizando DMAIC para los ciclos de mejora y el mapa de flujo de valor como diagnóstico del proceso.
2. ¿Qué aporta la IA a DMAIC que no aporte el control estadístico de procesos?
El SPC detecta que un proceso se ha salido de los límites de control después del hecho. La supervisión basada en visión con IA detecta la desviación en el momento en que se produce: el paso omitido, el componente equivocado, el movimiento fuera de estándar. El SPC le indica que existe un problema. La IA identifica dónde empezó y evita la siguiente aparición antes de que se produzca. Esa es la distinción fundamental.
3. ¿Cuánto se tarda en implantar supervisión con IA en un programa Six Sigma existente?
Los sistemas de IA en el borde que funcionan sobre las cámaras existentes, como NAGARE, se despliegan sin detener la línea. La mayoría de las plantas obtienen resultados medibles en los 12 meses siguientes al despliegue. La integración completa con el MES para registrar datos de ciclo añade de 4 a 8 semanas, según la infraestructura existente. Confirme el alcance y los plazos actuales directamente con Jidoka Technologies antes de planificar un despliegue (fuente).
4. ¿Qué es el rendimiento acumulado y por qué importa en Six Sigma?
El rendimiento acumulado (RTY) es la probabilidad de que una unidad supere todos los pasos de un proceso sin necesidad de retrabajo ni desperdicio. Se calcula multiplicando la tasa de éxito a la primera (First-Time-Right) de cada paso: 98 % × 95 % × 89 % = 83,2 % de RTY. Un rendimiento final del 97 % puede ocultar un RTY del 83 %, lo que significa que el 17 % de las unidades fueron manipuladas. El RTY es la métrica que hace visibles las pérdidas de la "fábrica oculta" en cualquier programa de optimización del rendimiento.