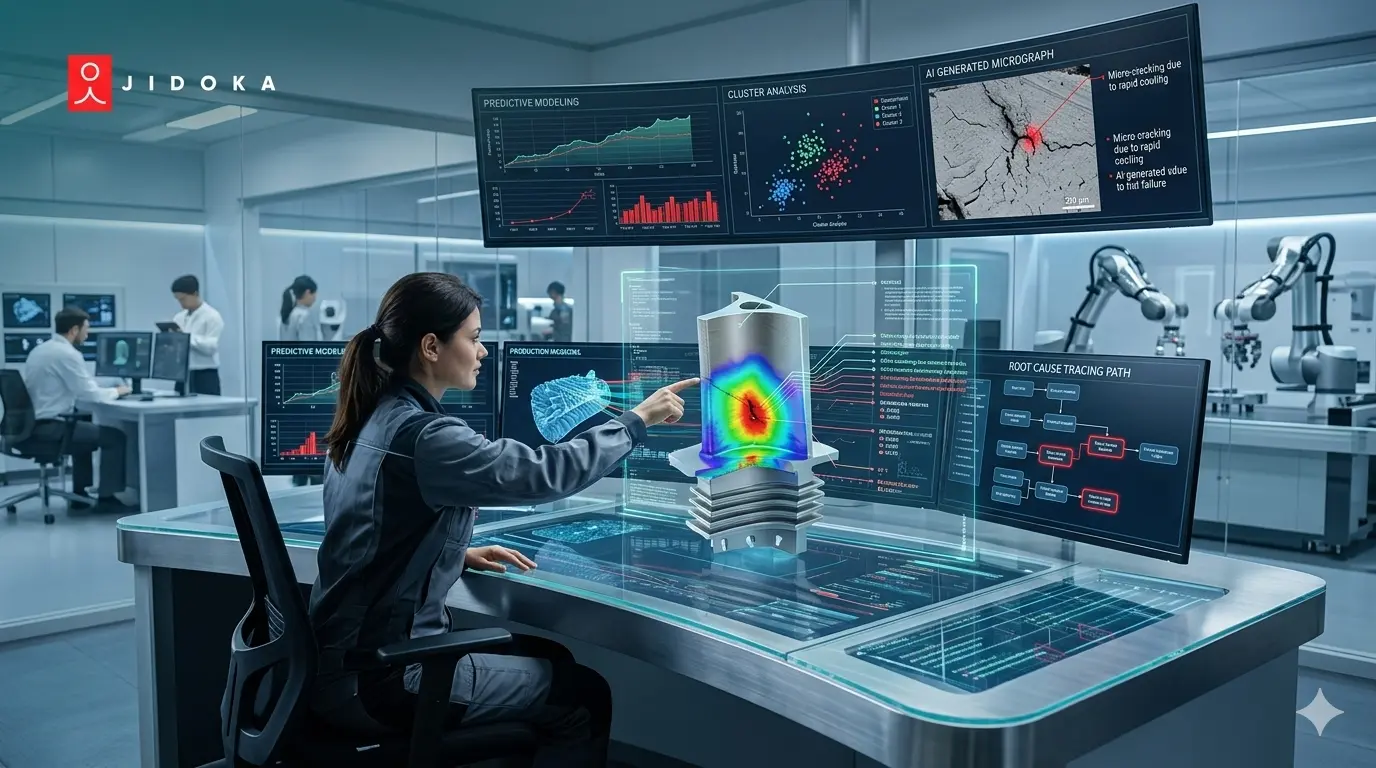
A quality team ran the same corrective action on a seal integrity defect three times in eight months. Each time, the Pareto analysis identified 'seal temperature deviation' as the top cause. Each time, the team adjusted the sealer setting. Each time, the defect returned within six weeks.
The real cause was conveyor vibration displacing product before the seal head, visible in the inspection image and invisible in the manual shift-end log. The production defect analysis method was correct. The data feeding it was incomplete.
This guide explains why that happens and how to fix it.
Production defect analysis identifies where, when, and why manufacturing rejects occur before a rising reject rate forces a line shutdown or a customer complaint triggers a recall. The three methods that drive real root cause discovery are Pareto analysis (to find the critical 20% of causes), Fishbone diagrams (to map contributing factors), and 5 Whys (to dig past symptoms to root causes). All three depend on accurate, structured defect rate manufacturing analysis data.
What Production Defect Analysis Is and Where Manual Methods Break Down
Production defect analysis is the systematic identification and classification of manufacturing rejects to find the root cause and prevent recurrence. When production defect analysis happens in real time, rising reject rates trigger corrective action before they become line shutdowns. When it happens 24 hours after the shift, the prevention window has already closed.
Uncontrolled process variation drives up to 70% of manufacturing defects, and most of that waste persists because teams misdiagnose the root cause on day one (Qualityze, May 2026). Teams that switched from manual spreadsheet-based root cause methods to integrated defect root cause methods platforms cut investigation time by 35% on average (Qualityze internal survey 2024). The bottleneck is data quality, not methodology.
The Four Categories of Manufacturing Defects Every Analysis Must Classify
A defect analysis framework is only useful if defects are consistently classified into categories that connect to actionable causes. A defect log with 40% of entries under 'other' or 'unknown' is not an analysis input. It is a problem to record.
1. Product Defects
Dimensional deviations, surface scratches, cosmetic failures, and functional failures. Root cause category: design specification gap or process variation. Detection method: KOMPASS inline inspection at 100% coverage, catching what periodic sampling misses.
2. Process Defects
Machine parameter drift (temperature, speed, pressure), operator sequence deviations, and SOP step omissions. Root cause category: process control failure. Detection method: NAGARE real-time step monitoring identifies which operator action created the deviation before the next unit is produced.
3. Material Defects
Incoming material non-conformance and batch-to-batch variation in raw material properties. Root cause category: supplier quality control gap. Requires a lot of traceability to isolate the specific batch, which automated sorting and counting records provide.
4. Environmental Defects
Contamination from ambient environment, temperature variation, and humidity-correlated failure clusters. Root cause category: facility control failure. These defects are frequently mislabeled as 'unknown' in manual logs because the environmental data is not correlated with the production data at entry time.
The Three Root Cause Methods That Drive Real Production Defect Analysis
The three defect root cause methods used in production defect analysis are Pareto analysis, Fishbone diagrams, and 5 Whys. They are most effective when used in sequence, not as independent alternatives. Pareto identifies what to investigate. Fishbone maps why it might be happening. 5 Whys drills to the correctable cause.
Step 1: Pareto Analysis to Find the Priority Defect Category
The Pareto principle applied to production defect analysis: 80% of defects are typically caused by 20% of failure modes (ResearchGate, Root Cause Analysis Using Fishbone Diagram). A real-world study of a manufacturing operation found that just two defect types caused over 55% of all rejects (International Journal of Indonesian Business Review, 2025). Identifying those two types first is what makes production defect analysis actionable.
The critical constraint: the Pareto chart is only as accurate as the defect classification log feeding it. A log where 30% of defects are entered as 'seal failure' without subcategory, and another 20% as 'visual reject' without further classification, does not produce a reliable Pareto priority. The Pareto is mathematically accurate. It is prioritizing the wrong problem because the input is incomplete. This is the data problem the seal defect scenario from this blog's opening illustrates directly.
Step 2: Fishbone Diagram to Map Contributing Factors
The Fishbone (Ishikawa) diagram maps plausible causes across six categories: Man, Method, Machine, Material, Measurement, and Environment. It requires cross-functional team input: quality engineers know the measurement and method categories; maintenance knows the machine category; process engineers know the method and material categories. No single quality engineer working from a spreadsheet has complete visibility across all six.
The output of the Fishbone is a contributing factor shortlist, not a root cause. The team votes on likelihood per factor, narrowing to two or three candidates for 5 Whys drilling. MES systems increasingly support digital Fishbone diagrams linked to defect records, so the evidence feeding the diagram comes from the production system rather than from meeting recall (Tulip, root cause analysis tools).
Step 3: 5 Whys to Reach the Correctable Root Cause
5 Whys drills from each contributing factor by asking 'why' at each level until a physical, correctable system condition is reached. The rule for stopping: when the answer to 'why' is something the team can actually change. 'Operator error' is not a root cause. 'The torque specification was not visible at the assembly station' is a root cause, because it identifies a specific correction.
The seal defect scenario from this blog's opening ran through 5 Whys three times, each time reaching 'seal temperature was outside tolerance.' It was a correct answer to the wrong question. The question should have started from the actual failure: product displacement before the seal head. That question never appeared in the Pareto because it never appeared in the defect log. The conveyor vibration cause was visible only in the inspection image, not in the operator's shift-end memory.
How AI Vision Closes the Data Gap That Makes Defect Analysis Fail
Production defect analysis accuracy is bounded by the quality of the defect classification data it runs on. Manual shift-end logs are delayed 8 to 24 hours, inconsistently categorized, and frequently incomplete. A Pareto chart built on manual log data prioritizes the most-remembered problem, not necessarily the most-frequent one.
KOMPASS Provides Classified Defect Data at the Point of Production
KOMPASS classifies every defect at the moment of detection: defect type, severity, lot code, line ID, timestamp, and annotated image. That classification happens automatically, consistently, and at 100% inspection coverage, generating the structured defect rate manufacturing analysis log that Pareto charts and Fishbone diagrams require to produce accurate outputs.
The structural difference: a manual log records what operators remember about defects at shift end. A KOMPASS log records what the inspection system observed about every unit as it was produced. The seal defect case would have shown a cluster of displacement-correlated rejects at specific conveyor speeds, visible in the data as a pattern no operator log entry would have captured. See how Jidoka's defect detection and label recognition use cases generate this structured record in practice.
NAGARE Catches Process Defects That Product Inspection Cannot See
Process defects (operator sequence deviations, SOP step omissions, incorrect machine parameters) produce no guaranteed surface artifact on the finished product. KOMPASS inspects the product. NAGARE monitors the process. When a process deviation occurs, NAGARE flags it in real time and logs the deviation type, timestamp, and operator, before the next unit is produced with the same defect.
This is the defect category that most production defect analysis programs attribute to 'unknown cause': the product defect is real, the Pareto data is real, but no product inspection record connects the defect to its process origin. NAGARE provides that connection by logging the process event alongside the product inspection event, enabling Fishbone analysis to address the actual cause.
The Closed-Loop System: From Detection to Verified Correction
Complete production defect analysis architecture uses KOMPASS and NAGARE together: KOMPASS detects and classifies the product defect; the classified log feeds the real-time Pareto; the Pareto drives Fishbone and 5 Whys investigation; corrective action is assigned and loaded into NAGARE as a digital SOP update; NAGARE verifies the corrective action is followed on every subsequent cycle; KOMPASS confirms the defect rate declines.
This closed loop converts production defect analysis from a retrospective exercise into a prevention mechanism. Every production cycle feeds back into the data that the next investigation will use. The CAPA that ran three times on the same seal defect would have required only one run if the inspection image data had driven the Pareto priority from the start.
The Metrics That Confirm Production Defect Analysis Is Working
Three metrics confirm that production defect analysis is producing accurate root cause identification: defect rate trend (is the priority defect category declining after CAPA?), escape rate (are defects still reaching customers?), and CAPA recurrence rate (is the same corrective action being opened more than once?)
Defect Rate and Escape Rate
Defect rate measures rejects found by inspection before shipment. Escape rate measures defects that passed inspection and were found by the customer. A plant with a low defect rate and a high escape rate has a detection coverage gap, not a production quality improvement. Reducing escape rate requires closing the inspection gap, which 100% AI inspection coverage addresses directly.
Both metrics should be tracked by defect category. If the Pareto priority was 'seal integrity' and the CAPA targeted seal temperature, the correct validation metric is the seal integrity defect rate for 90 days after CAPA closure. Generic scrap rate reduction tracking cannot confirm whether the specific root cause was addressed.
CAPA Effectiveness Metrics
Three CAPA effectiveness metrics confirm production defect analysis quality: recurrence rate (same defect category reopened within 90 days indicates wrong root cause identified), CAPA closure time (open CAPAs beyond 30 days indicate unresolved risk), and manufacturing reject rate tracking post-CAPA (category-specific defect rate decline confirms the corrective action addressed the real cause, not the symptom).
The seal defect team's three-cycle CAPA history would have flagged a recurrence rate problem after the second opening. A production waste analysis framework that includes recurrence tracking would have prompted a data-source review before running the third identical correction.
Jidoka Technologies and Production Defect Analysis
KOMPASS and NAGARE address the data problem that makes production defect analysis tools produce wrong answers: they replace manual shift-end logs with structured, real-time, classified inspection records at 100% production coverage.
- KOMPASS: Structured defect classification at the point of production. Every unit: defect type, severity, timestamp, lot, line. Feeds Pareto with AI-classified data, not operator memory.
- NAGARE: Process deviation logging per operator step. Connects process events to product defects. Verifies corrective action compliance every cycle.
- Industries: Active across automotive, FMCG, electronics, pharmaceuticals, and general manufacturing.
See how KOMPASS turns every production defect into a structured data record for defect root cause methods at jidoka-tech.
Conclusion
The quality team that ran the same CAPA three times was using the right production defect analysis method on the wrong data. The corrective action targeted the logged symptom (temperature setting), not the actual cause (conveyor vibration) that only appeared in the inspection image.
The classified inspection record from KOMPASS would have shown displacement-correlated defects spiking at a specific line speed, visible in the data and invisible in the manual log.
See how KOMPASS turns every production defect into a structured data record at jidoka-tech.ai.
Frequently Asked Questions
1. What Is Production Defect Analysis?
Production defect analysis is the systematic process of identifying, classifying, and investigating manufacturing rejects to find root causes and implement corrective actions before defect rates escalate into line shutdowns or customer escapes. It relies on three sequential methods: Pareto analysis to identify the priority defect category, Fishbone diagrams to map contributing causes, and 5 Whys to drill from contributing factors to the correctable root cause.
2. What Are the Most Common Root Cause Methods for Manufacturing Defects?
Los tres métodos de análisis de causa raíz más utilizados en el análisis de defectos de fabricación son el análisis de Pareto, los diagramas de espina de pescado (Ishikawa) y los 5 porqués. Pareto identifica qué tipo de defecto investigar. El diagrama de espina de pescado mapea todas las causas contribuyentes plausibles en cuanto a mano de obra, método, maquinaria, materiales, medición y medio ambiente. Los 5 porqués profundizan en cada factor contribuyente hasta llegar a la causa raíz corregible. Estos tres métodos son más efectivos cuando se utilizan en esa secuencia, no como alternativas independientes.
3. ¿Cuál es la diferencia entre la tasa de rechazo y la tasa de escape en el análisis de defectos?
La tasa de rechazo mide los defectos detectados mediante inspección en la línea de producción antes del envío; la tasa de escape mide los defectos que superaron la inspección y fueron encontrados por el cliente. Ambas métricas son necesarias para un análisis completo de la tasa de defectos en la fabricación. Una planta con una tasa de rechazo baja y una tasa de escape alta tiene una brecha en su inspección: su sistema de detección no identifica ciertos tipos de defectos. Reducir la tasa de escape requiere mejorar la cobertura de detección, no solo el proceso de producción.
4. ¿Cómo mejora la visión artificial el análisis de la causa raíz de los defectos en la fabricación?
Los sistemas de visión artificial mejoran el análisis de la causa raíz de los defectos al generar datos de defectos completos, clasificados de manera consistente y en tiempo real con una cobertura de inspección del 100%, reemplazando los registros manuales de fin de turno que suelen ser tardíos, inconsistentes y, a menudo, incompletos. Cuando un gráfico de Pareto se construye a partir de datos de inspección por IA en lugar de la memoria de los operarios, refleja lo que realmente ocurrió en la línea y no lo que se recordó. Esa precisión determina si la acción correctiva aborda la causa raíz correcta.
5. ¿Cómo se reduce la tasa de desperdicio en la fabricación?
La reducción de la tasa de desperdicio comienza por identificar las tres categorías principales de defectos mediante el análisis de Pareto, realizar una investigación de causa raíz en cada una utilizando el diagrama de espina de pescado y los 5 porqués, implementar acciones correctivas verificadas y realizar un seguimiento de la recurrencia durante 90 días después del cierre de la CAPA. Un objetivo de reducción de desperdicio que no esté vinculado a la reducción de categorías de defectos específicas no es ejecutable. Priorice el 20% de las causas de defectos responsables del 80% del desperdicio.