Production Monitoring: The Complete 2026 Guide for Manufacturing Teams

Real-time production monitoring explained for plant managers: OEE, downtime tracking, process adherence, and how edge AI closes the gap between what your line is doing and what your ERP reports.

Most plant managers find out about a line stoppage the same way: someone walks into the office and tells them.

The cameras were running. The PLC was logging. The ERP had data queued up. None of it sent an alert. That gap between data collected and action taken is exactly what separates production monitoring done right from production monitoring that just fills a dashboard nobody checks.

This guide covers real time production tracking, OEE, process adherence, and a five-phase path to closing the visibility gap before your next shift ends.

What Production Monitoring Actually Measures and What It Does Not

Most factories already collect data. The problem is they collect it from the wrong layer, or they collect it too late to act on.

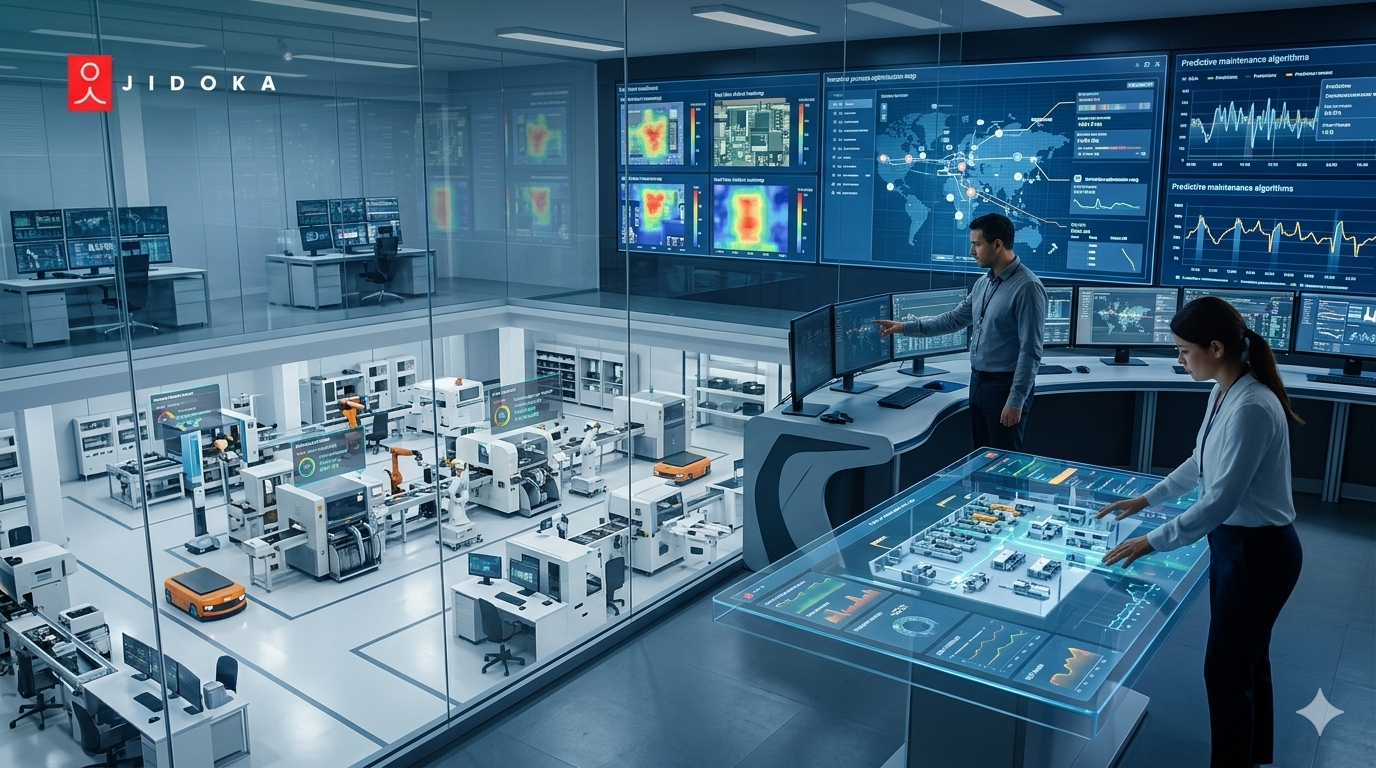
Production monitoring is the continuous, automated capture of machine state, throughput, downtime events, cycle times, and quality yields, displayed in real time to operators, supervisors, and leadership. Its job is not report generation. It is floor-level decision-making, during the shift, not after it.

It is not:

  • MES: manages work orders and scheduling
  • SCADA: controls equipment
  • ERP: records transactions after they happen
  • Quality inspection: verifies product conformance

All four can receive data from production monitoring. None of them replace it.

At any moment, a functioning production floor visibility system answers four questions: Is the machine running? Is it running at rated speed? Is it producing good output? What stopped it last?

The global production monitoring market reached $6.47 billion in 2025, driven by one discovery manufacturers keep making: real-time visibility pays for itself faster than any other plant investment.

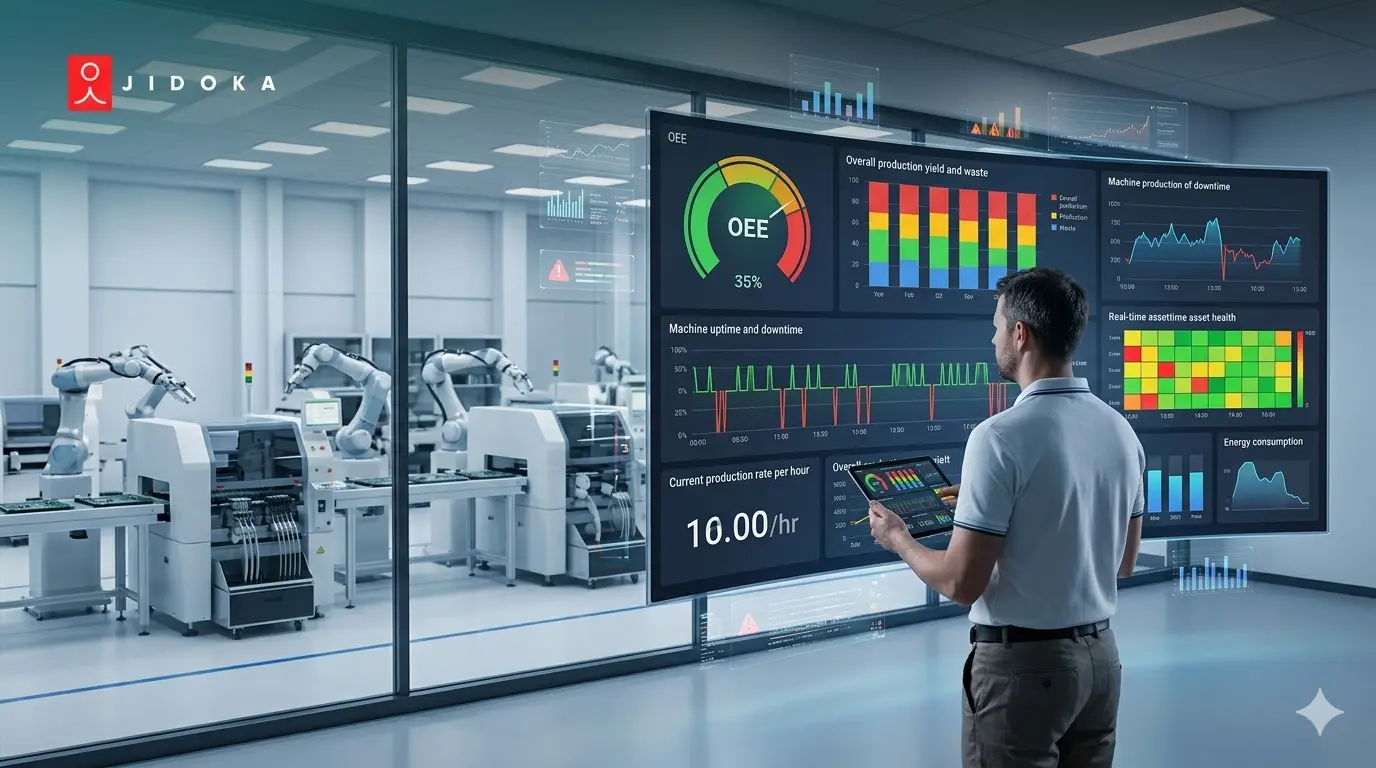
OEE is where that visibility gets quantified, and where most plants find out how much they have been missing.

OEE: What It Measures, What Most Plants Get Wrong, and Why the Benchmark Matters

Most plants think they know their OEE. Most are wrong, because they are measuring it on incomplete data.

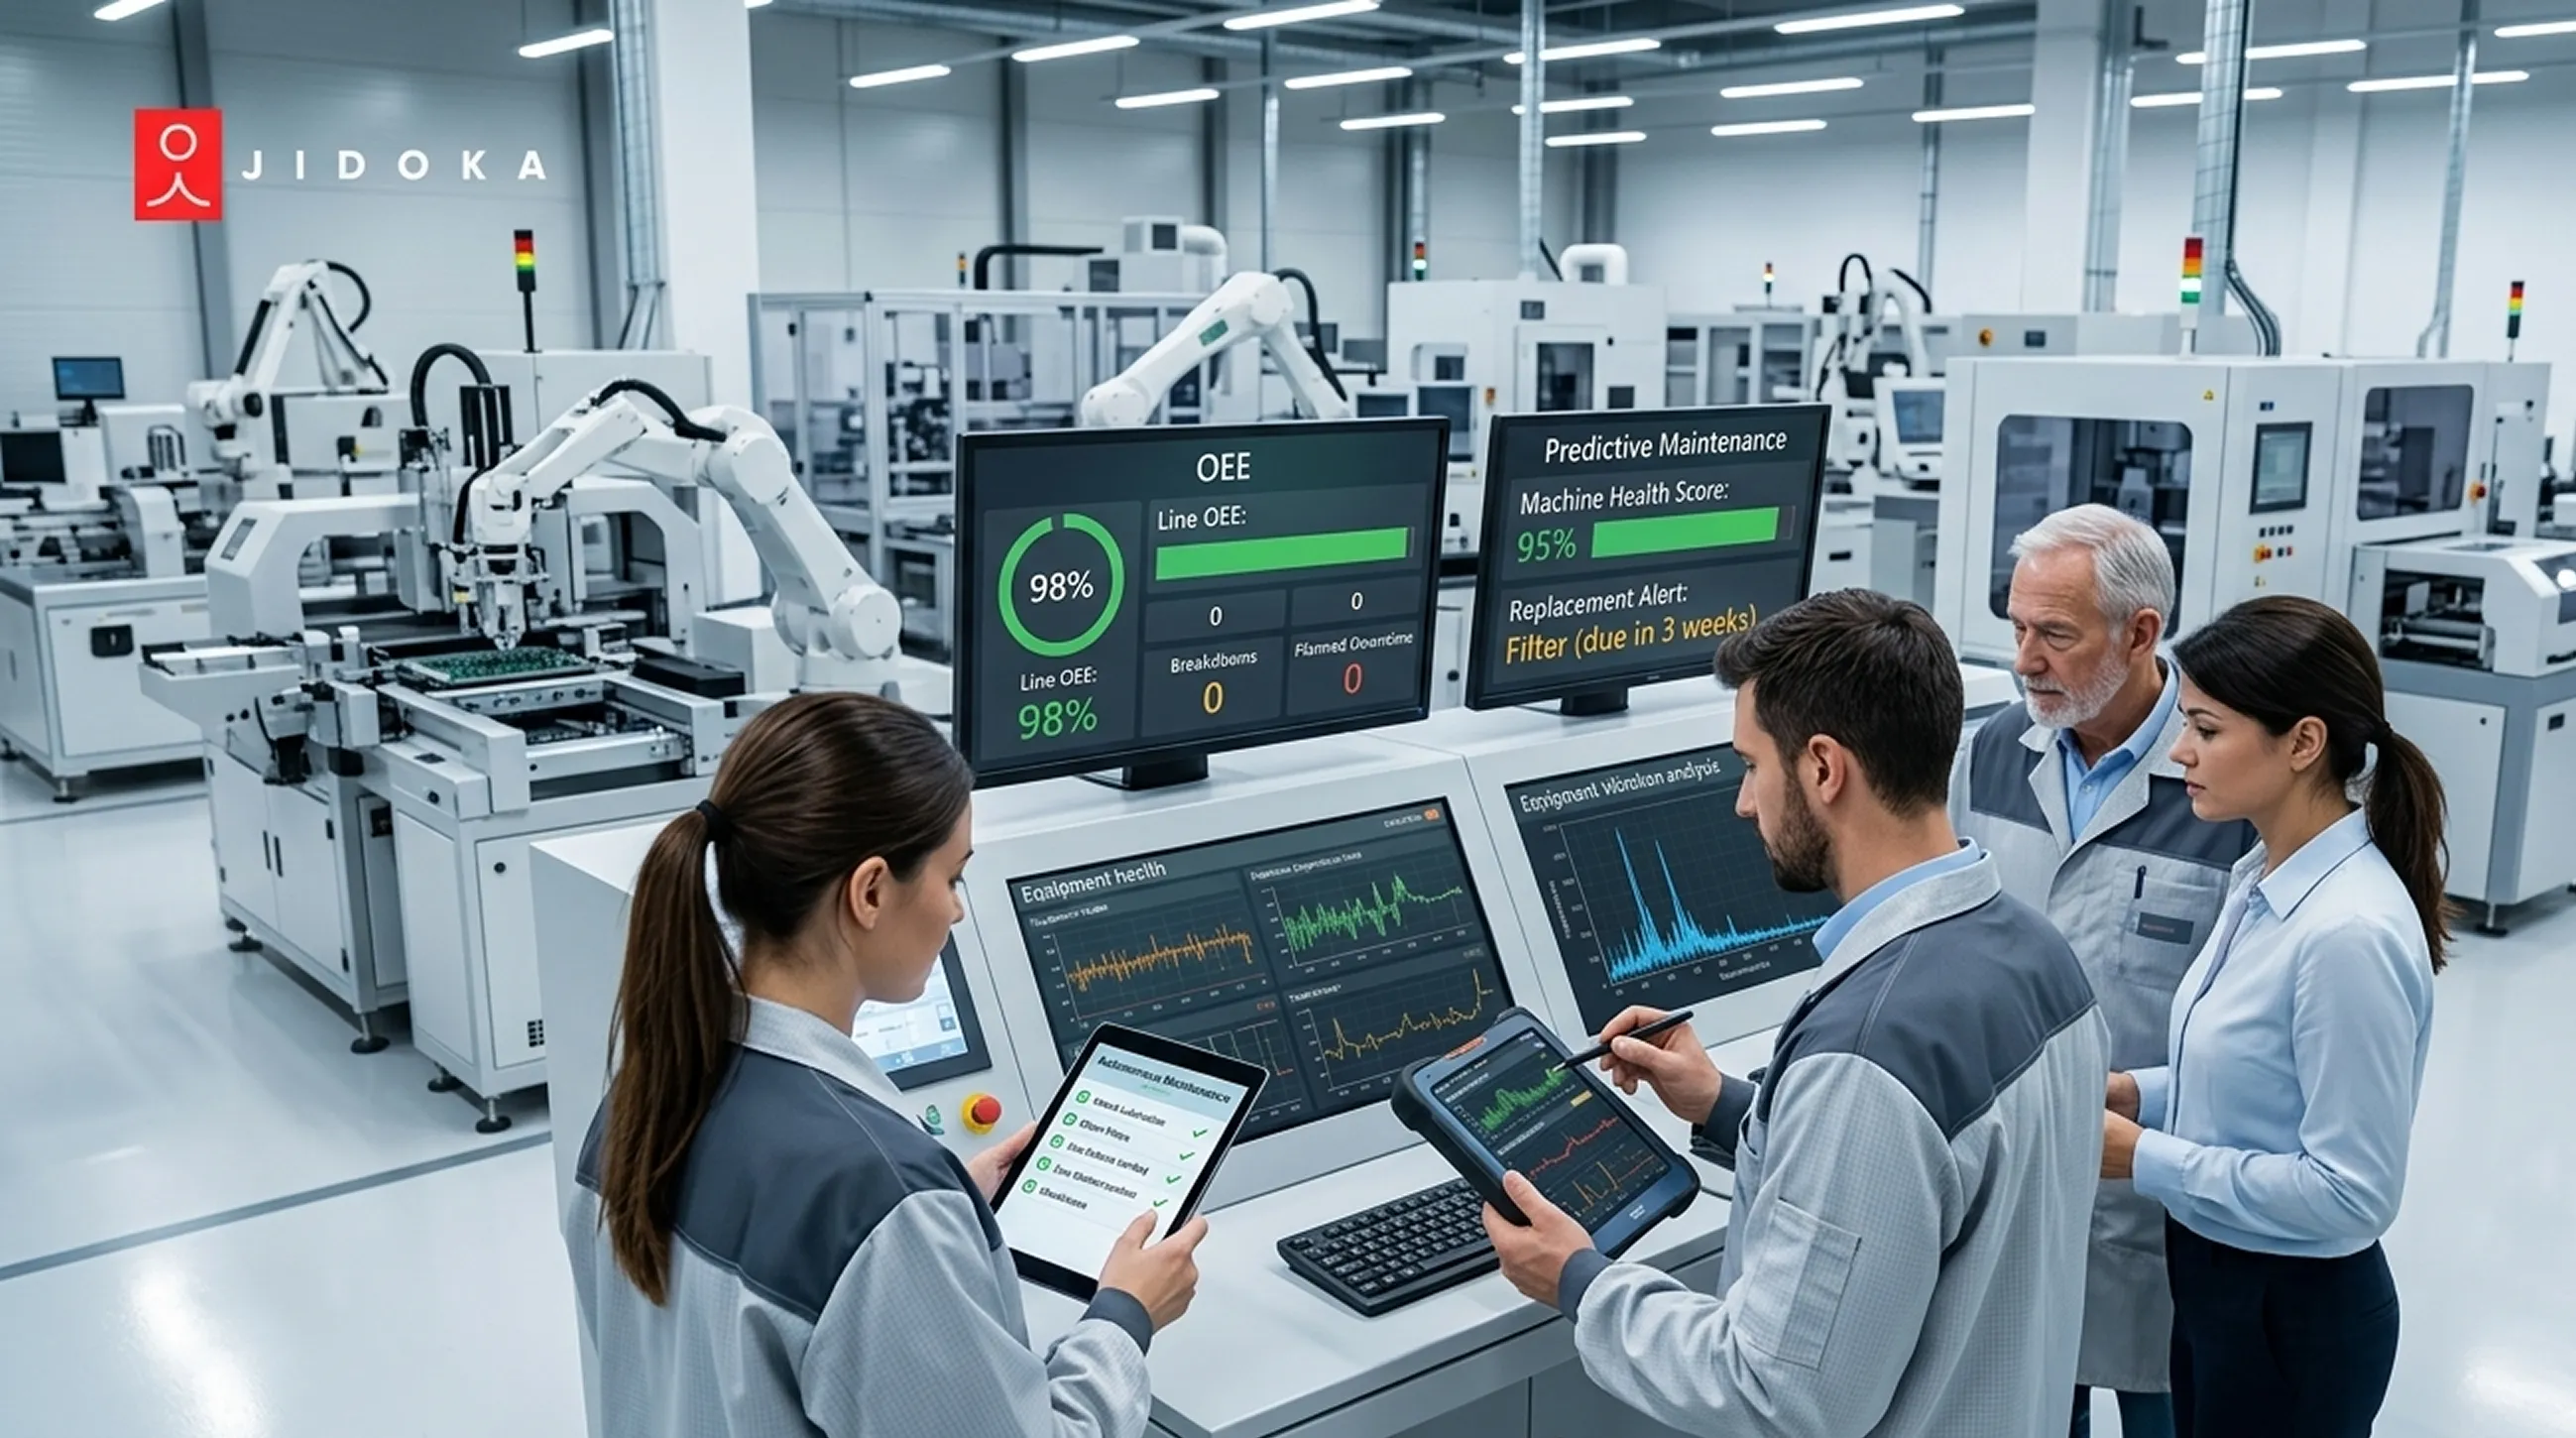
OEE (Overall Equipment Effectiveness) = Availability x Performance x Quality

A score of 100% means the machine ran every scheduled minute, at full rated speed, producing zero defects. World-class OEE sits at 85% for discrete manufacturing. Most US plants run between 55% and 65%. That 20 to 30 point gap is not a machine problem. It is a visibility problem.

Here is what a low score on each component actually signals:

  • Availability below 80%: unplanned downtime and changeover problems
  • Performance below 90%: micro-stoppages and speed losses, the invisible capacity killer
  • Quality below 95%: process instability or incoming material issues

Research consistently shows micro-stoppages consuming 8 to 15% of total production time in plants without automated tracking. A 6-second conveyor pause feels trivial. Multiply it by 80 occurrences per shift and you have lost over an hour that appears nowhere in your shift report.

For a plant running $50M in annual production, a 10-point OEE gain represents approximately $5.5M in recovered throughput, with no additional CapEx required.

The benchmark gap exists because most plants cannot see what they are losing. The next section explains exactly where that invisibility lives in your production monitoring chain.

The Visibility-to-Action Chain: Why Data Collection Is Not the Same as Production Monitoring

The Visibility-to-Action Chain: Why Data Collection Is Not the Same as Production Monitoring

Your plant collects data. Good. Now ask yourself: what happened the last time a machine dropped below rated speed? Did the system tell someone in 60 seconds, or did the shift report mention it the next morning?

That gap is the visibility gap. It sits between when a production monitoring event occurs and when someone on the floor takes corrective action. Narrow it and OEE improves. Leave it open and all your factory production monitoring investment is just generating history, not preventing losses.

There are three tiers of production floor visibility:

  • Level 1: data collected, reported post-shift. The floor is blind during the shift.
  • Level 2: live dashboard visible to supervisors. Action depends on someone noticing.
  • Level 3: alert pushed directly to the operator at the machine within 60 seconds of the event.

Level 3 is where recovery actually happens.

The path from data to recovery runs through five links in the real time production tracking chain:

  1. Data Capture: automated, continuous. Manual logs miss 30 to 50% of stops. Automated capture misses zero.
  2. Real-Time Display: live OEE per machine, visible on the floor, not in a back office.
  3. Threshold Alert: pushed to the right person the moment a defined limit is crossed.
  4. Floor Intervention: the physical response. This is the only link that actually reduces the loss.
  5. Result Log: mandatory close-out. The alert does not clear until someone logs what they did.

One of the most common production monitoring challenges is alert fatigue. Too many notifications with no defined response protocol and operators stop reading them entirely. Start with three to five alert types. Add more only after the first set has an embedded response habit.

Plants that close this chain cut downtime by up to 40%. The ones that stop at Level 2 dashboards keep filing morning reports about yesterday's losses.

Production monitoring at Level 3 closes the machine side. But there is a second layer most OEE systems never reach: what the operator is actually doing at the station. That is where production inspection falls short without a smarter layer on top.

What Incoming Quality Inspection Actually Controls and What It Does Not?

Most IQC guides treat incoming quality inspection and final product inspection as interchangeable. They're not. Confusing the two is how defects slip through undetected.

Incoming quality inspection controls one thing: the quality of inputs entering your production line. It does not govern what happens on the floor, how operators handle material, or what the finished goods inspection catches at the end. Those are separate gates with separate owners.

Quality Inspection Gates in Manufacturing
No. Gate What It Inspects When It Fires
1 Incoming Quality Inspection (IQC) Supplier delivered raw materials, components, and packaging At goods receipt, before production
2 In Process Quality Control (IPQC) Work in progress at each manufacturing stage Continuously during production
3 Final Product Inspection (FPI) Finished goods before dispatch Post production, pre shipment

IQC covers every material category your supplier touches: raw materials, sub-components, packaging, labels, and consumables. Not just machined parts.

Getting IQC right starts with treating it as a hard gate. The next section shows exactly what that looks like.

How to Implement Production Monitoring: A Phased Approach

Most factory production monitoring deployments fail not because the technology is wrong but because the sequence is. Plants buy a platform, install sensors, and expect OEE improvement within weeks. What they get instead is a dashboard nobody acts on.

The sequence matters more than the software. Here is the five-phase path that consistently works.

Phase 1: Measure

Deploy machine-level OEE sensors or connect to existing PLCs. Target: real time production tracking per machine, per shift. Wireless OEE sensors on a discrete manufacturing floor deploy in one to two weeks. Year-one total cost of ownership runs $40,000 to $150,000 per plant. No PLC modification required on most equipment vintages.

Phase 2: Identify

Run the system for four to six weeks without changing anything. Use the data to rank losses by frequency and impact. Identify the three to five machine-event combinations driving the majority of lost availability. This is your Pareto. Without it, Phase 3 is just guessing.

Phase 3: Alert

Configure threshold alerts for the top loss sources from Phase 2. Define a response protocol for each alert type: who responds, within what timeframe, with what action. Start with three to five alert types maximum. Production monitoring without a response protocol is a notification system, not a performance tool.

Phase 4: Close the Loop

Log every floor intervention against the alert that triggered it. This creates the closed-loop dataset that proves whether the system is actually reducing losses over time. No log means no proof. No proof means no budget for Phase 5.

Phase 5: Extend to Process Adherence

Once machine-level production performance monitoring is stable and alert response protocols are embedded, add process adherence monitoring at the highest-variability stations. Typical OEE improvement from completing Phases 1 to 4 within the first six months: five to twelve OEE points. Phase 5 closes the last mile of production floor visibility that machine sensors alone cannot reach. 

Getting the sequence right is one challenge. Knowing where deployments break down before you go live is another. 

Production Monitoring Challenges and How to Resolve Them Before Deployment

Every production monitoring deployment looks clean on paper. The sensor installs in 15 minutes, the dashboard goes live, and the plant manager expects OEE to climb. Then six months pass and nothing has changed. Here is why that happens, and how to stop it before you go live.

Challenge 1: Data Without Definition

OEE data arrives but nobody agrees on what "downtime" means. One operator logs a jam as a mechanical stop. Another logs it as a process issue. The Pareto analysis is worthless. Build a standardized downtime reason code library before go-live. Cap it at 15 to 20 codes. More than that and operators stop using it consistently.

Challenge 2: Alert Fatigue

Too many alerts with no response protocol. Operators learn to ignore them within two weeks. This is one of the most common production monitoring challenges in first deployments. Start with three to five alert types. Add more only after the first set has an embedded floor response habit.

Challenge 3: No Closed Loop

Interventions happen but nobody logs them. Management sees alerts firing and cannot tell whether the system is working. Make the intervention log mandatory. The alert does not close until a response is recorded. No exceptions.

Challenge 4: Legacy Equipment Connectivity

Older machines have no PLC or digital output. Non-intrusive current sensors clip onto a machine's power supply cable, detect production cycles automatically, require no machine modification, and install in 10 to 15 minutes per machine. Real time production tracking works on equipment of any vintage. The machine does not need a digital output. The sensor provides it.

Challenge 5: Lack of Floor Buy-In

Operators see factory production monitoring as surveillance. Adoption stalls. The fix is straightforward: give operators access to their own station's OEE data in real time via an Andon board or tablet. Visible production floor visibility data improves efficiency by 15 to 29% through operator engagement alone (iFactory AI, 2026).

Run through these five challenges before your deployment kicks off. A production monitoring system that clears all five has a measurable OEE improvement within six months. One that skips them produces a dashboard nobody trusts.

Quick Glance: 5 Pre-Deployment Challenges and Fixes
# Challenge Root Cause Fix
1 Data Without Definition No agreed downtime taxonomy across operators Build a reason code library of 15 to 20 codes before go live
2 Alert Fatigue Too many notifications with no response protocol Start with 3 to 5 alert types and expand gradually
3 No Closed Loop Interventions happen but are never logged Keep alerts open until intervention logging is completed
4 Legacy Equipment Connectivity No PLC or digital output on older machines Use clip on current sensors with no machine modification required
5 Lack of Floor Buy In Operators view monitoring as surveillance Provide operators with live access to their own station OEE data

Where Jidoka Technologies Closes the Gap

Most production monitoring vendors stop at machine-level OEE. Jidoka Technologies goes two layers deeper, combining real-time production inspection with process adherence verification into a single edge-deployed stack.

Plants running Jidoka's setup report consistent production performance monitoring performance at 12,000+ parts per minute and up to 300 million inspections per day. Two systems drive that:

1. KOMPASS: High-Accuracy Inspector

  • 99.8%+ accuracy on live lines
  • Reviews each frame in under 10 ms
  • Learns new variants with 60 to 70% fewer training samples
  • Handles reflective metals, printed surfaces, and textured parts

2. NAGARE: Process and Assembly Analyst

  • Tracks 100% of assembly steps through existing cameras
  • Flags missing parts and wrong sequences in real time
  • Cuts rework by 20 to 35%

Both systems run on local edge units. No cloud dependency. No latency. Production floor visibility stays intact across all shifts, even at the highest line speeds.

Ready to close the visibility gap on your production floor? Let's connect with Jidoka Technologies.

Conclusion

Production monitoring gives plant managers the one thing shift reports never could: visibility while there is still time to act.

Most plants already have the data. Cameras running, PLCs logging, ERP queued up. Yet losses compound quietly across every shift. Micro-stoppages go unlogged. Operator deviations go undetected. By the time the morning report lands, the throughput is gone and the defects are already in the batch.

That is not a technology gap. It is a visibility gap.

Jidoka Technologies closes it at both layers, machine performance and process adherence, before the shift ends, not after. Let's connect with Jidoka Technologies and find out exactly where your visibility gap is costing you throughput 

Frequently Asked Questions

Q1. What is production monitoring in manufacturing?

Production monitoring is the continuous, automated capture of machine state, cycle times, output counts, downtime events, and quality yields displayed in real time. Its purpose is floor-level intervention during the shift, not post-shift reporting. It is the measurement backbone behind every OEE improvement program.

Q2. What is the difference between production monitoring and MES?

Production monitoring answers what is happening on the floor right now. MES answers what should be happening and what has been completed. Both coexist. Real time production tracking data feeds MES for more accurate scheduling, but MES cannot replace live production floor visibility during an active shift.

Q3. How long does production monitoring implementation take?

Factory production monitoring using wireless OEE sensors deploys in one to two weeks on most equipment vintages without PLC modification. Measurable OEE improvement of five to twelve points typically arrives within six months. Adding process adherence monitoring at key stations takes two to four additional weeks per line.

Q4. What is process adherence monitoring and how does it differ from OEE?

OEE measures machine performance. Process adherence monitoring measures whether operators follow the correct steps, in the correct sequence, at the correct speed. A line can report acceptable OEE while stations run non-standard sequences. Production inspection using AI vision, like Nagare by Jidoka Technologies, catches those deviations in real time.

Q5. Can production monitoring work on older manufacturing equipment?

Yes. Clip-on current sensors detect machine state on equipment of any age without PLC access or modification. Production performance monitoring platforms are built for mixed-age fleets. The only requirement is that sensor data feeds a system calculating OEE in real time with configurable alert thresholds.

May 27, 2026
By
Sekar Udayamurthy, CEO of Jidoka Tech

相談会開催中

品質と生産性を最大化するビジョン検査システムに関する相談会を実施中です。ぜひこの機会にお試しください。

お問い合わせ