47% of manufacturers now use AI in quality processes in 2026, up from 33% in 2025, with 71% expecting quality spending to increase (Pulse of Quality in Manufacturing 2026 Survey, GlobeNewswire, June 3, 2026). The acceleration reflects a structural problem with continuous improvement manufacturing: PDCA, kaizen continuous improvement, and Six Sigma are built on data loops, but the data feeding those loops is still collected manually on most shop floors.
AI monitoring changes what CI can deliver by making the Check phase continuous. This guide will explain the main CI frameworks, where they break down at scale, and how AI process monitoring closes the gap.
What Is Continuous Improvement Manufacturing and Why Do Classic Frameworks Hit a Data Wall?
Continuous improvement manufacturing frameworks rely on accurate, timely data from the Check phase of each improvement cycle. When that data comes from manual floor walks and periodic logs, the improvement loop runs on monthly cycles. When AI provides it automatically per production cycle, the loop compresses to per-shift cycles without adding headcount.
1. PDCA: The Foundation That Most Plants Run on Stale Data
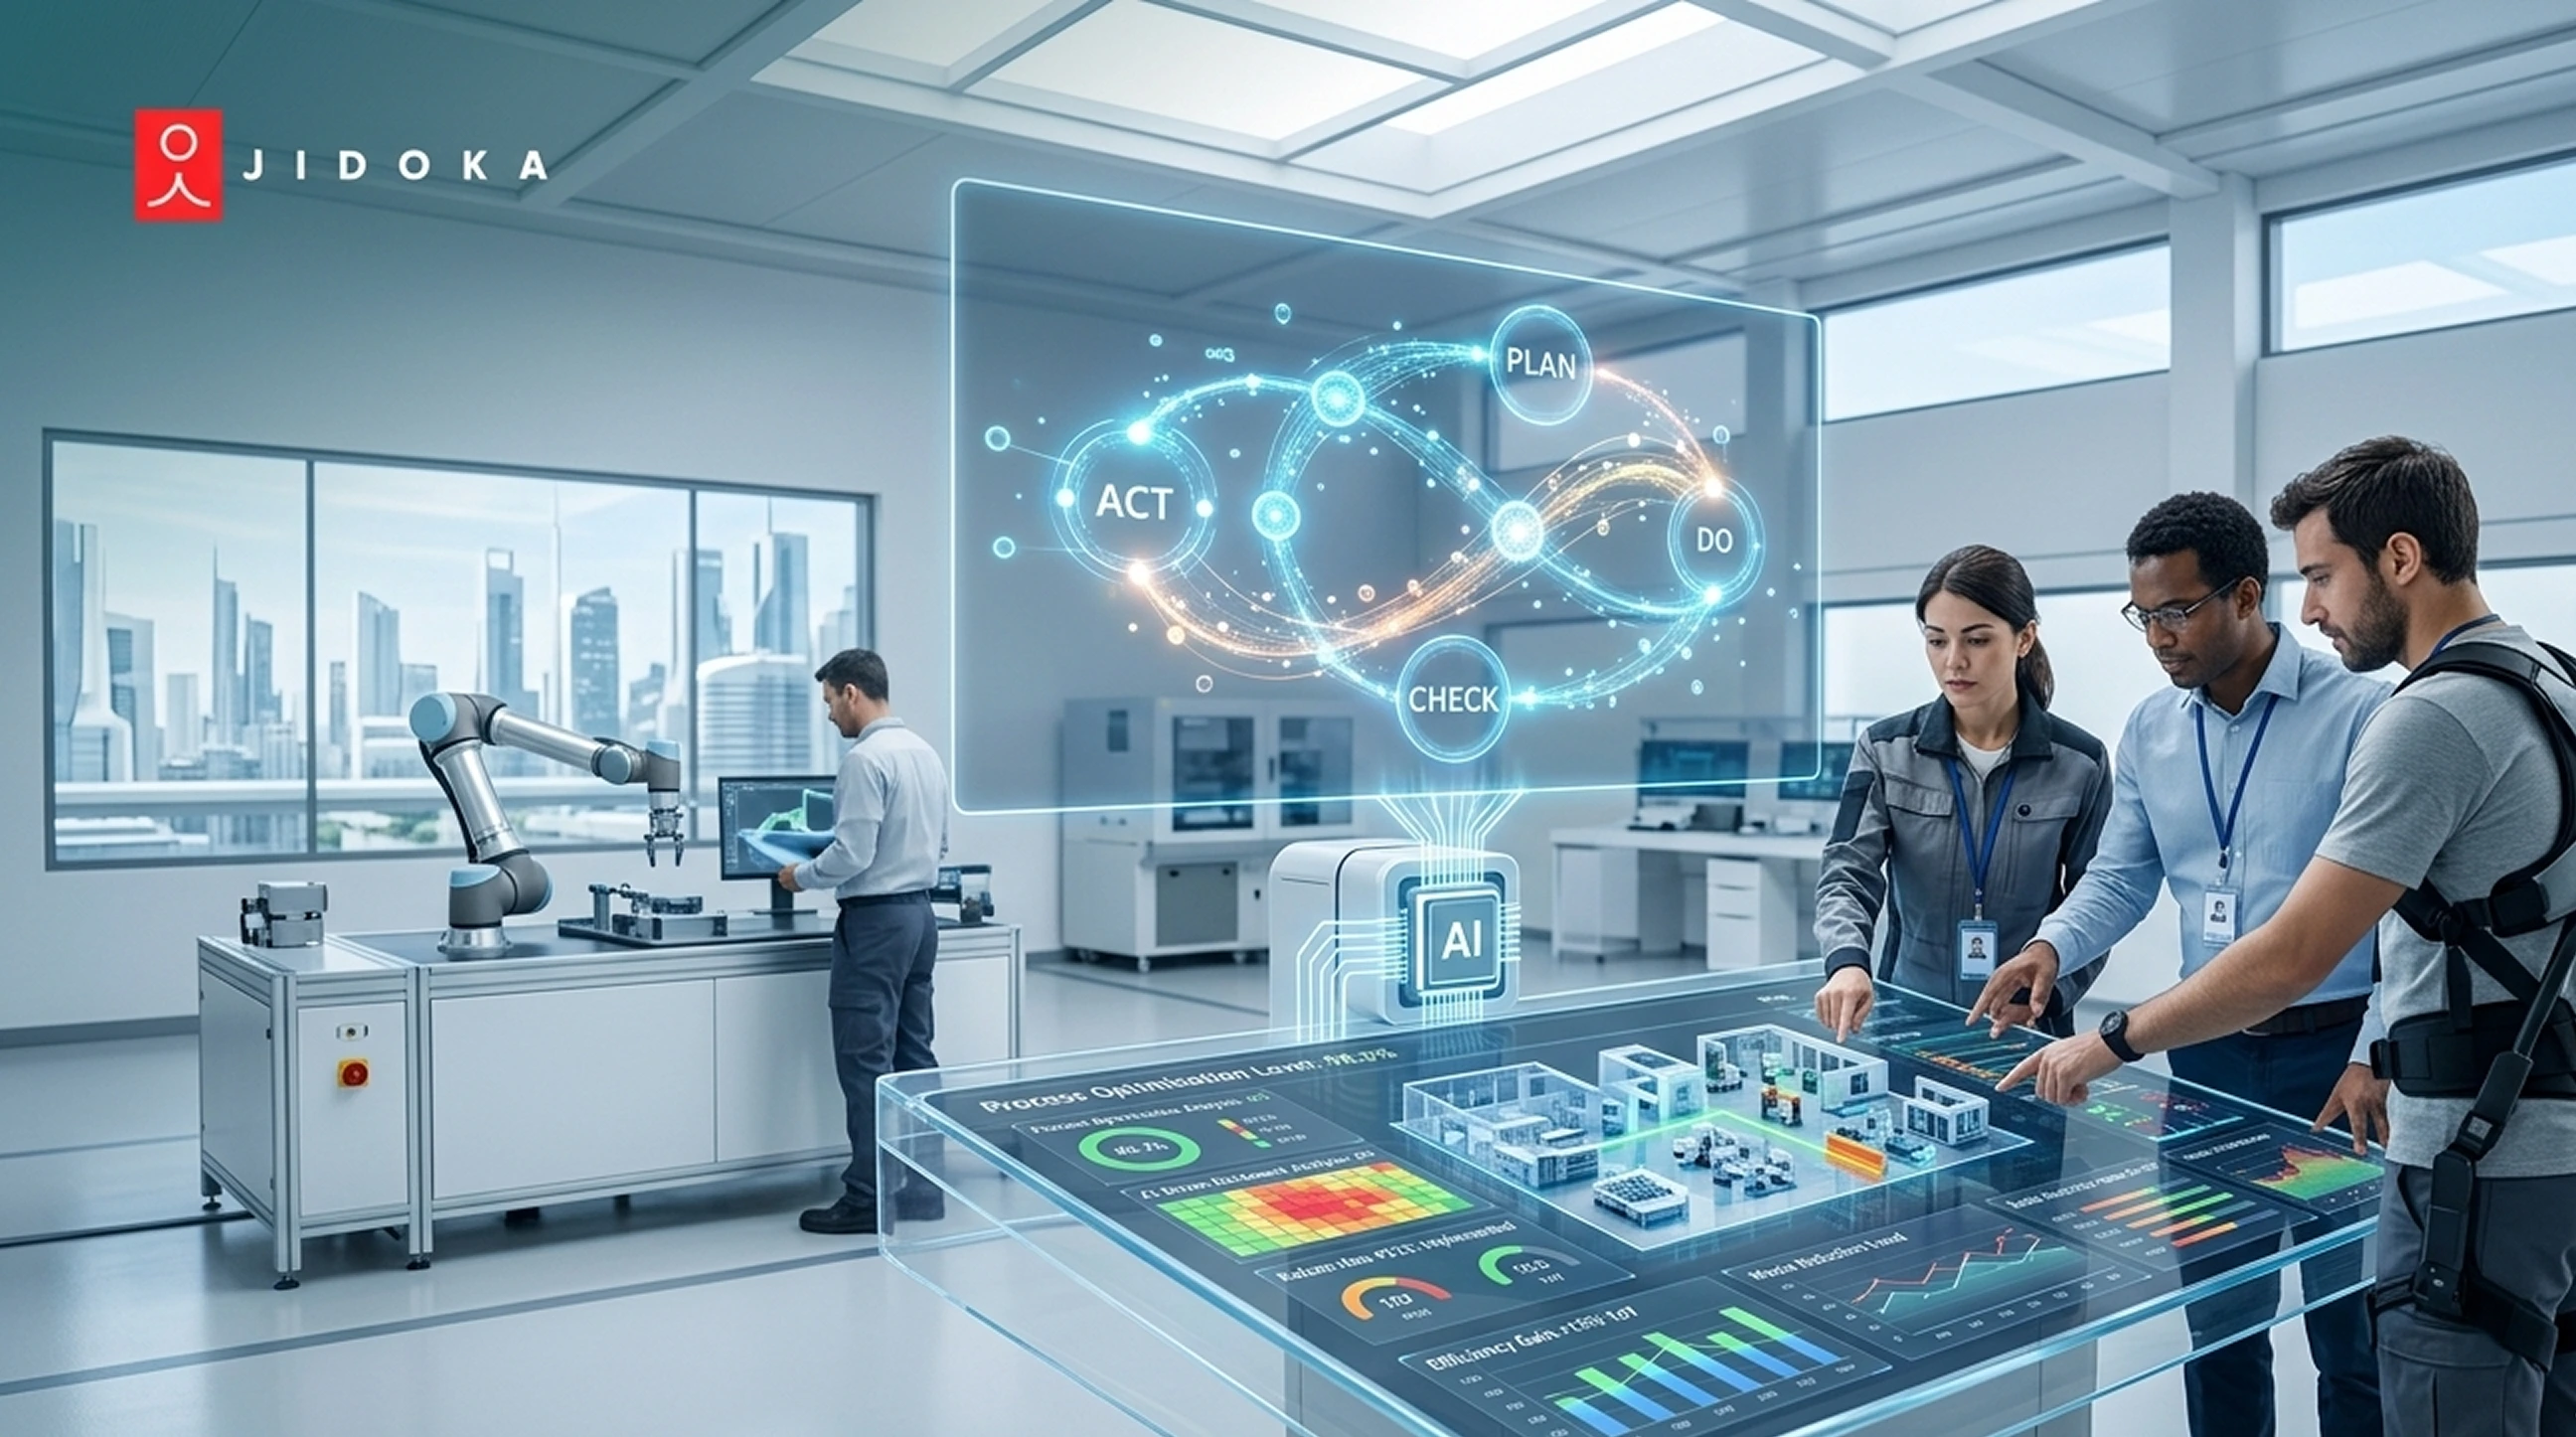
The PDCA cycle (plan do check act manufacturing) runs in four phases: Plan defines the problem and target improvement; Do implements the change at small scale; Check compares actual results against expected; Act standardizes the improvement or revises the approach. The cycle repeats continuously. Its effectiveness depends entirely on the accuracy and timeliness of data in the Check phase.
Most plants collect Check-phase data once per shift from operator logs, manual quality checks, and spot sampling. That data arrives hours after the process events it describes. A defect rate that spiked at 10:00 AM appears in the Check data at 14:00, and in the Act decision at the next day's morning meeting. The continuous improvement manufacturing cycle that should take days takes weeks because the Check phase runs on a lag.
2. Six Sigma DMAIC and the Measurement Problem
Six Sigma's DMAIC structure (Define, Measure, Analyze, Improve, Control) requires statistically valid datasets in both the Measure and Control phases. On most factory floors, the Measure phase data is sampled, not complete. Sampled defect data contains statistical noise that inflates the apparent variation and makes the actual root cause harder to identify in the Analyze phase.
The manufacturing improvement framework that Six Sigma provides is sound. The data it needs to function at full effectiveness requires 100% inspection coverage and step-level process records, both of which manual collection cannot provide at production scale. This is the structural data wall that all three major CI frameworks share: they are built for complete data and deployed with incomplete data.
3. Value Stream Mapping and Its Retrospective Limitation
Value stream mapping (VSM) for operational improvement manufacturing identifies non-value-added delays between process cells. The limitation VSM shares with all static analysis tools: it shows the waste that existed when the observation was made, not the waste accumulating right now. A VSM created on Monday accurately describes Monday. By Friday, shift patterns, machine states, and operator mix have all changed.
The same applies to manual time studies and floor observations used to feed lean continuous improvement baselines. Kaizen event teams frequently discover that the baseline data collected before the event does not match the production reality they observe during the event, because manual sampling cannot capture the full variation across shifts, operators, and machine states. See how Jidoka's systems address this for general manufacturing and automotive CI programs.
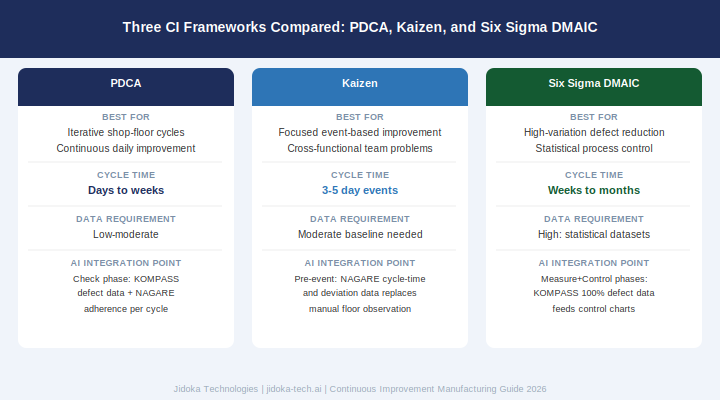
Figure 1: PDCA vs Kaizen vs Six Sigma DMAIC: best use case, cycle time, data requirement, and AI integration point for each framework
How Do Manufacturing Kaizen Events Drive Lean Continuous Improvement at the Shop Floor Level?
Manufacturing kaizen events are focused, time-boxed workshops (typically 3 to 5 days) where a cross-functional team analyzes a specific process problem, tests a solution, and implements a standard. Their effectiveness depends on the accuracy of the baseline data going in and the monitoring rigor that sustains the improvement after the event ends.
How to Structure a Kaizen Event That Delivers Lasting Gains
Five standard stages govern manufacturing kaizen events that produce sustainable results. Preparation: define scope, gather baseline data, set measurable targets. Day 1: observe and map the current state, validate the baseline against what the team actually sees on the floor. Days 2 to 3: generate and test solutions using the verified baseline. Day 4: implement and standardize the winning solution, update the SOP. Day 5: report out results and set the 30-day audit schedule.
The baseline data used in preparation determines how accurate the improvement target is. If defect or cycle-time data is based on manual sampling, the baseline is distorted before the event starts. A lean continuous improvement event with a distorted baseline produces an improvement target that may be overshot or undershot, making the act of measuring success ambiguous from the outset.
Why Kaizen Gains Degrade Between Events
The most common kaizen continuous improvement failure mode: operators return to pre-event habits within weeks of the event closing. The improvement was real during the event but was not embedded in a way that survives normal shift variation. A new standard was created; no enforcement mechanism ensures every operator follows it on every cycle, every shift.
NAGARE's digital work instructions and real-time SOP verification provide the lean continuous improvement enforcement layer that closes this gap. Every production action is compared against the approved standard and deviations are flagged in real time. The improvement from the Kaizen event becomes physically enforced, not just documented.
What Data a Kaizen Event Needs That Manual Observation Cannot Provide
Kaizen teams need three data types that manual observation cannot provide reliably: cycle-time variation by operator and shift (not just average cycle time, but the full distribution showing when and why it spikes), micro-stop frequency and duration by station (brief unplanned stops that never reach the maintenance ticket threshold but collectively consume significant capacity), and step-level deviation from standard work sequence (which operator steps are being skipped or reordered, and how often).
NAGARE provides all three automatically from existing camera infrastructure, giving manufacturing kaizen events teams a factual baseline that replaces subjective floor observation. The Jidoka NAGARE page notes that traditional AI systems 'lack deep traceability, limiting Kaizen initiatives', a positioning point that applies directly here.
What CI Tools Does a Continuous Improvement Manufacturing Program Actually Need in 2026?
A continuous improvement manufacturing program in 2026 needs four tool categories: a manufacturing improvement framework for structuring improvement cycles (PDCA or DMAIC), a waste analysis method (value stream mapping or 5 Whys), a real-time data collection layer, and a standard work enforcement mechanism. The first two are well established. The last two are where most programs fall short.
1. Framework Tools: PDCA, DMAIC, and A3
Three primary framework tools cover most ci manufacturing tools requirements. PDCA for iterative shop-floor improvement where speed matters more than statistical rigor. DMAIC for data-heavy Six Sigma projects in high-variation processes where the root cause requires statistical analysis to isolate. A3 for structured root-cause documentation: a single-page format that forces teams to define the problem, the current state, the analysis, the target state, and the action plan in a format a plant manager can review in five minutes.
A3 is named for the A3 paper format but the value is disciplinary: it limits problem definition to what fits on one page, forcing teams to prioritize the essential causal chain over comprehensive documentation. It works well as the documentation format for the manufacturing improvement framework output from either a PDCA cycle or a Kaizen event.
2. Waste Identification Tools: VSM, 5 Whys, and Fishbone
VSM identifies non-value-added delays between process cells. 5 Whys traces a specific defect event back through five layers of causation to the actual system failure. Fishbone (Ishikawa) diagrams map causes across machines, methods, materials, measurement, environment, and people simultaneously for multi-cause problems.
The limitation these tools share: they are retrospective. VSM shows the waste that existed when the observation was made. 5 Whys describes a defect event that already happened. Fishbone analysis addresses a failure pattern already visible in production data. Continuous improvement manufacturing tools designed for real-time visibility, not retrospective analysis, require a different data input than any of these provide on their own.
3. Real-Time Data and Standard Work Enforcement: Where AI Fills the CI Gap
NAGARE delivers three data streams that CI programs need: cycle-time distribution by station and shift (for performance variation analysis), step-level SOP adherence data (for standard work enforcement), and deviation frequency by operator (for training prioritization). KOMPASS delivers defect rate data at 100% inspection coverage for quality trend analysis feeding pdca quality cycle Check cycles.
Manufacturing AI achieves 200% average ROI, the highest of any sector, because every AI improvement maps to a cost already being measured (Capgemini Research Institute, Smart Factories Report 2025). NAGARE process outcomes: 30% increase in process adherence, 35% reduction in rework, 25% boost in productivity, 30% decrease in supervision and training costs .
How Does AI Process Monitoring Strengthen a Manufacturing Improvement Framework?
AI process monitoring strengthens a manufacturing improvement framework by automating the data collection that PDCA, Kaizen, and Six Sigma rely on. Instead of Check data arriving once per shift from manual logs, AI delivers cycle-level data continuously, accelerating improvement loops from monthly cycles to per-shift cycles without adding headcount.
1. How NAGARE Accelerates the PDCA Check Phase
NAGARE monitors every production cycle against the approved digital SOP, classifying each cycle as compliant or deviant and logging the deviation type, timestamp, and operator. This converts the plan do check act manufacturing Check phase from a manual data collection exercise into a continuous automated stream. Shift supervisors receive deviation alerts within the shift, not at shift end, enabling Act decisions in minutes rather than weeks.
The Integrated Lean plus AI performance benchmark from Jidoka's manufacturing optimization blog: 20 to 40% throughput gains, 35 to 50% defect reduction, 8 to 10 month payback. Versus Traditional Lean Only: 15 to 25% throughput, 10 to 15% defect reduction, 12 to 18 month payback. The performance gap is the Check phase cycle time: continuous improvement manufacturing runs faster when its data loop runs continuously.
2. How KOMPASS Feeds Defect Data Into CI Tracking
KOMPASS provides 100% inline inspection at up to 12,000 PPM, generating a defect rate signal that updates continuously rather than at shift end. This defect trend data feeds six sigma manufacturing DMAIC control charts, PDCA quality metrics, and manufacturing kaizen events baselines with accurate, complete production data rather than sampled, end-of-line counts.
The difference in CI program quality is substantial: a Six Sigma project using 100% KOMPASS defect data identifies the actual root cause distribution. The same project using 10% sample data works with a distorted distribution. The manufacturing improvement framework output is only as accurate as the data inputs feeding it. See how KOMPASS defect detection and label verification integrate with CI programs.
3. What WEF Lighthouse Network Data Says About AI-Led CI
The World Economic Forum Global Lighthouse Network found that 189 leading industrial facilities captured an average 53% increase in labor productivity, with AI process oversight cited as the primary driver.
Lean without real-time monitoring runs on audit cycles too slow for modern production speeds. AI without lean has no standard to enforce. Continuous improvement manufacturing achieves the most when structured CI frameworks define what should happen and AI monitoring verifies whether it does. Neither delivers the full performance gain without the other. See how NAGARE and KOMPASS accelerate your existing CI program.
How Jidoka Accelerates Continuous Improvement Manufacturing Programs
NAGARE's step-level process data and KOMPASS's 100% defect coverage give CI programs the two data inputs that manual observation and sampling have never been able to provide simultaneously: real-time, complete defect data and real-time, complete process compliance data.
- NAGARE: Digital work instruction enforcement with real-time SOP adherence monitoring. Feeds PDCA Check and Kaizen baselines with cycle-level data. 30% process adherence gain.
- KOMPASS: 100% defect detection at production speed. Feeds Six Sigma control charts and PDCA quality metrics with complete data, not sampled approximations.
- Across industries: Active CI support in automotive, FMCG, electronics, and general manufacturing.
Book a deployment assessment to see how NAGARE and KOMPASS data close the Check-phase gap in your existing CI program.
Conclusion
Continuous improvement manufacturing frameworks have not changed. PDCA, Kaizen, and Six Sigma are as sound in 2026 as when Toyota defined them. What has changed is the data available to feed their Check and Measure phases.
AI process monitoring makes the Check phase continuous, giving CI teams cycle-level data that manual observation never could. See how NAGARE accelerates your existing CI program at jidoka-tech.ai.
Frequently Asked Questions
1. What is continuous improvement in manufacturing and what frameworks does it use?
Continuous improvement manufacturing is the practice of making regular, incremental changes to eliminate waste, reduce defects, and improve throughput. The three primary frameworks are PDCA (Plan-Do-Check-Act) for iterative shop-floor cycles, Kaizen for daily incremental improvement and structured events, and Six Sigma's DMAIC structure for statistically driven defect reduction in high-variation processes.
2. What is the PDCA cycle and how does it work in manufacturing?
The PDCA cycle runs in four phases: Plan defines the problem and target improvement; Do implements the change on a small scale; Check compares actual results against expected; Act standardizes the improvement or revises the approach. In continuous improvement manufacturing, the cycle repeats continuously. Its effectiveness depends on the accuracy and timeliness of data in the Check phase, which is where most plants have the largest gap.
3. How do manufacturing Kaizen events differ from daily Kaizen practice?
Manufacturing Kaizen events are focused workshops, typically 3 to 5 days, where a cross-functional team analyzes a specific process problem, implements a solution, and sets a new standard. Daily Kaizen practice is the ongoing habit of small improvements by all operators across every shift. Events create the standard; daily practice and standard work enforcement tools like NAGARE's digital SOPs sustain it between events.
4. What data does a CI manufacturing program need that manual observation cannot provide?
Manual observation cannot provide cycle-level deviation data, micro-stop frequency by station and shift, or step-level SOP compliance per operator. These three data streams are what PDCA Check cycles and Kaizen baselines need to be accurate. NAGARE captures all three automatically from existing camera infrastructure and delivers them in real time, replacing periodic floor walks with continuous automated monitoring.
5. What ROI does AI-assisted continuous improvement deliver compared to traditional lean alone?
Traditional lean programs deliver 15 to 25% throughput gains over 12 to 18 months. Integrating AI process monitoring with lean accelerates this to 20 to 40% throughput gains and 35 to 50% defect reduction at 8 to 10 month payback, because the Check phase runs on every cycle rather than every shift. Manufacturing AI achieves 200% average ROI, the highest of any sector, because improvements map to costs already being measured. (Capgemini Research Institute, Smart Factories Report 2025; jidoka-tech.ai/blogs/manufacturing-optimization-using-ai)