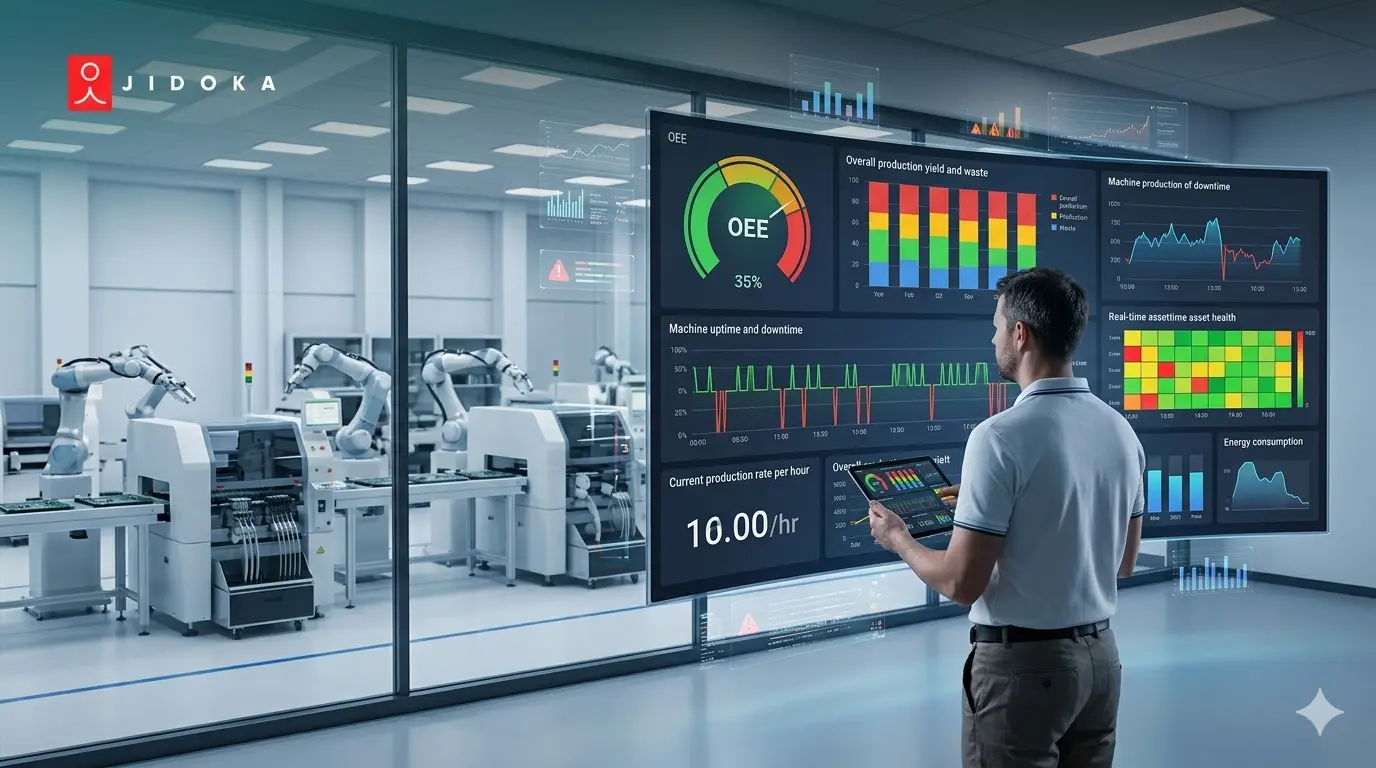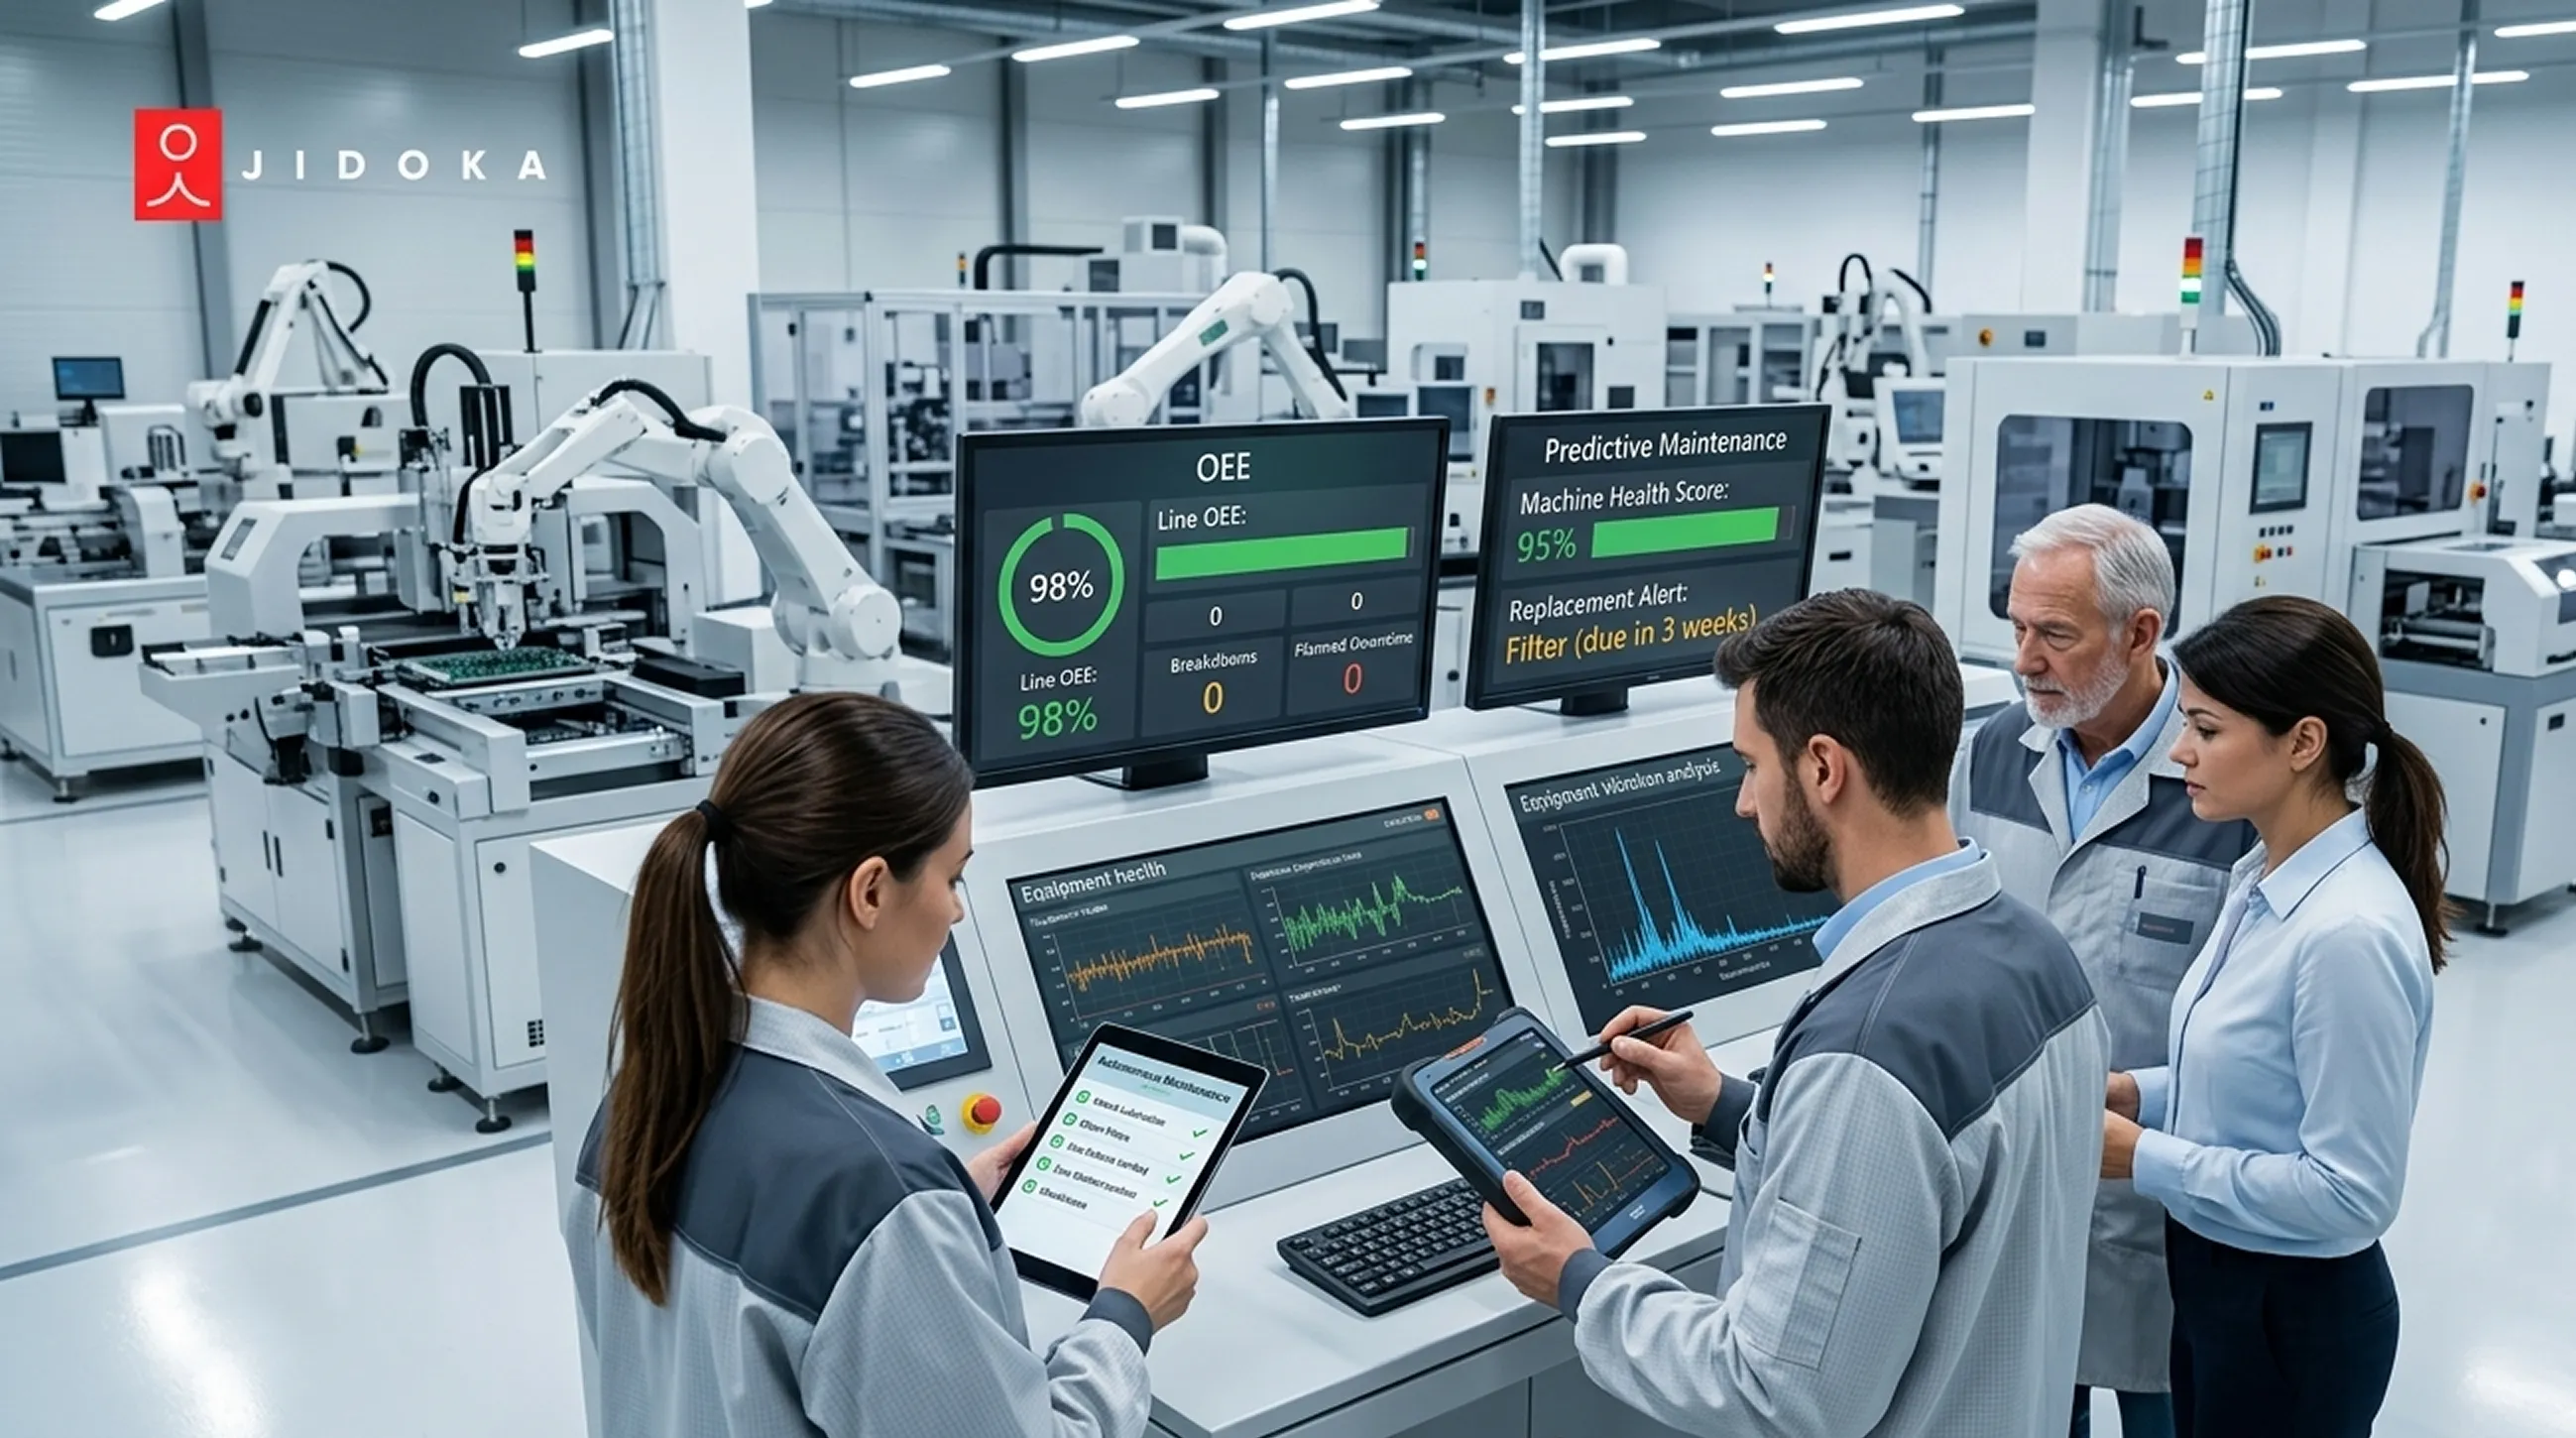
AI quality inspection is transforming production lines by replacing inconsistent manual checks with measurable, data-backed results. Instead of relying on broad claims, manufacturers now evaluate systems using benchmarks like detection rate, false positives, precision, and inference speed.
These AI inspection performance metrics define how well a solution detects defects, reduces waste, and sustains throughput. Paired with measures such as recall, mAP, and throughput tracking, they provide a complete picture of inspection accuracy.
Systems like Jidoka’s Kompass™ deliver up to 99.9% accuracy at line speeds of 12,000 parts per minute and boost throughput by over 30%. By applying these metrics in production environments, teams achieve compliance, minimize escapes, and maintain consistent quality across high-volume manufacturing.
Understanding Core AI Inspection Performance Metrics
Choosing the right AI quality inspection system depends on measurable outcomes, not broad promises. Manufacturers must review validated benchmarks that prove how systems handle defects at production speed.
The most reliable approach is to analyze AI inspection performance metrics like detection rate, false positives, precision, and recall, since these directly impact yield, compliance, and throughput.
A) Detection Rate vs. False Positives
A high detection rate shows the ability to identify defects, but excessive false positives cause rework and disrupt throughput. Balanced results matter more than inflated numbers.
Systems trained on strong benchmark datasets and validated against real production images maintain accuracy across line changes, lighting shifts, and product variations.
B) Precision & Recall: Why Both Matter
Model precision ensures flagged items are true defects, while recall confirms all issues are captured. Optimizing both together using structured validation standards avoids costly escapes.
Metrics like mAP and confusion matrices provide deeper insights into deep learning accuracy, ensuring systems perform reliably in real-time inspection.
Once accuracy metrics are clear, the next step in evaluating AI quality inspection is measuring speed by looking at inference speed and throughput to confirm that inspection keeps pace with high-volume production lines.
Measuring Speed in AI Quality Inspection: Inference & Throughput
Speed is just as critical as accuracy in AI quality inspection. Even the most precise models fail if they cannot keep up with line rates. Manufacturers measure this using AI inspection performance metrics tied to inference speed and throughput, which reflect how inspection fits into real production cycles.
A) Inference Time and Cycle Efficiency
Inference speed refers to how quickly the model processes each frame or part. In high-volume factories, systems must deliver real-time inspection within sub-100ms latency to keep cycle times stable.
Delays cause bottlenecks, missed scans, or skipped items. Measuring inference time end to end including sensor capture, preprocessing, and output provides the most accurate benchmark.
B) Throughput Metrics in Real Environments
True performance shows in sustained throughput. Reliable systems process thousands of parts per minute under varying lighting, product complexity, and conveyor speeds.
By validating throughput with benchmark datasets and production images, manufacturers confirm whether deep learning accuracy remains consistent without slowing down lines or creating missed detections.
While speed keeps production flowing, accuracy benchmarks and validation standards define whether an AI quality inspection system can consistently meet industrial requirements.
Benchmarking Accuracy: Best Practices & Industrial Validation Standards
Accuracy in AI quality inspection goes beyond marketing claims. Manufacturers rely on structured AI inspection performance metrics such as mAP, confusion matrices, and validation standards to measure how systems perform under real operating conditions.
These methods ensure inspection results are not only impressive in testing but also reliable on the shop floor.
A) Key Benchmarking Techniques
Methods like mAP at different IoU thresholds, precision-recall curves, and confusion matrices provide insight into model precision and recall. Using well-labeled benchmark datasets helps teams evaluate deep learning accuracy across diverse defect types. Combining these tools builds a clear performance profile that is repeatable and transparent.
B) Validation Protocols in Manufacturing
Structured validation ensures systems deliver in production. Manufacturers test using controlled image sets, cross-line checks, and real-time inspection under changing line speeds and lighting.
Sector-specific protocols, such as automotive or FMCG compliance, confirm that inspection benchmarks translate into consistent quality and regulatory approval.
Once the right benchmarks are defined, the next step is to see how trusted providers like Jidoka translate these metrics into real production results.
How Jidoka Can Help You Hit Inspection Benchmarks
Selecting an AI quality inspection partner means reviewing measurable performance supported by real deployments. Jidoka focuses on AI inspection performance metrics that prove value in production environments.
Key strengths of Jidoka’s Kompass™ system:
- High Accuracy: Achieves 99.5–99.9% defect detection with consistent model precision and recall.
- Speed at Scale: Supports real-time inspection at line speeds of up to 12,000 parts per minute.
- Lower False Positives: Cuts unnecessary rejects by 30–40%, boosting yield and throughput.
- Proven Deployments: 48+ trusted customers worldwide with 100+ successful implementations across industries.
- Transparent Benchmarking: Dashboards track detection rate, throughput, and deep learning accuracy across shifts.
- Validated Deployment: Domain-trained models and strict validation standards ensure compliance in automotive, electronics, and FMCG.
By aligning with these benchmarks, Jidoka ensures AI quality inspection delivers measurable accuracy, scalability, and day-to-day business value.
Connect with Jidoka today to achieve accurate, scalable, and compliant AI quality inspection.
Conclusion
AI Inspection Accuracy Benchmarks are the foundation for selecting the right system. Metrics like detection rate, false positives, precision, recall, inference speed, and throughput define whether an AI quality inspection solution truly performs in production. These benchmarks give manufacturers measurable proof of reliability instead of surface-level accuracy claims.
When inspection systems are judged only on lab results, they often fail in production. Variable lighting, fluctuating line speeds, and product complexity quickly expose weaknesses, leading to inconsistent results. Accuracy that looks strong in controlled settings can collapse under real-world pressures.
The outcome is damaging. Defects slip through unnoticed, false rejects disrupt throughput, and compliance risks increase. These issues waste resources, raise operational costs, and erode customer trust.
Jidoka’s solution addresses these challenges by combining high accuracy with real-time inspection and transparent benchmarking. Our Kompass™ system ensures that AI quality inspection delivers consistent results, minimizes false rejects, and maintains production efficiency across demanding manufacturing environments.
Let Jidoka optimize your production lines with AI quality inspection that delivers measurable accuracy and consistency.
FAQs
1. What is a good detection rate for AI quality inspection?
A reliable AI quality inspection system achieves a detection rate of 97–99% when validated with benchmark datasets and production images. Strong AI inspection performance metrics like recall and mAP confirm accuracy under real conditions. Consistent results with minimal false positives make the system dependable for high-volume throughput and compliance.
2. Why are false positives important in inspection?
Too many false positives in AI quality inspection slow production, increase rework, and create unnecessary costs. Evaluating AI inspection performance metrics such as precision ensures flagged items are truly defective. Balanced detection with reduced over-rejects improves throughput, maintains compliance, and delivers consistent quality across demanding real-time inspection environments.
3. How is inference speed measured in inspection systems?
Inference speed in AI quality inspection measures how quickly a model processes each frame or part. Industrial systems require sub-100ms latency for real-time inspection. Tracking throughput together with inference speed provides complete insight into cycle efficiency, ensuring inspection keeps pace with high-speed lines without reducing deep learning accuracy.
4. What benchmarking methods define accuracy in AI quality inspection?
Common methods include mAP, precision-recall curves, confusion matrices, and validation standards built on real defect samples. These AI inspection performance metrics measure model precision and recall accurately. Benchmarking with benchmark datasets ensures AI quality inspection delivers measurable accuracy and repeatable performance instead of lab-only results, keeping production lines compliant and efficient.
5. Can inspection accuracy drop in real production?
はい、AIによる品質検査の精度は、ラインの速度や照明条件、製品の複雑さが変化すると低下する可能性があります。適切な検証基準がなければ、優れたモデルであっても信頼性は損なわれます。検出率やスループットといったAI検査のパフォーマンス指標を継続的に監視することで、製造現場における現実的な課題の中でも、一貫した精度の維持、不良流出の削減、そしてコンプライアンスの向上を実現できます。
6. AI検査のパフォーマンス指標から最も恩恵を受ける業界はどこですか?
自動車、電子機器、日用消費財(FMCG)、医薬品などの分野では、コンプライアンスとスループットを管理するためにAI品質検査が不可欠です。適合率、再現率、推論速度といったAI検査のパフォーマンス指標を評価することで、安定した生産体制を維持できます。これらの業界では、ベンチマークデータセットの活用やリアルタイム検査を通じて、高い品質を維持し、欠陥を減らし、ブランドへの信頼を守っています。